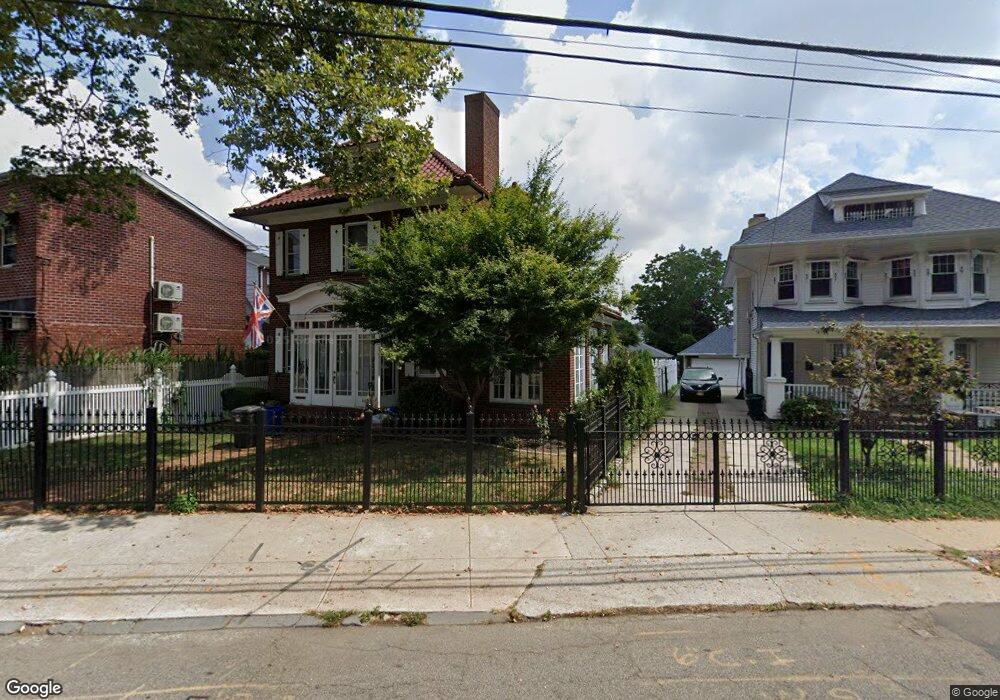
4663 Parsons Blvd Flushing, NY 11355
Flushing NeighborhoodEstimated Value: $1,265,545 - $1,682,000
--
Bed
--
Bath
2,166
Sq Ft
$667/Sq Ft
Est. Value
About This Home
This home is located at 4663 Parsons Blvd, Flushing, NY 11355 and is currently estimated at $1,444,886, approximately $667 per square foot. 4663 Parsons Blvd is a home located in Queens County with nearby schools including P.S. 024 Andrew Jackson School, Rachel Carson I.S. 237Q, and Francis Lewis High School.
Ownership History
Date
Name
Owned For
Owner Type
Purchase Details
Closed on
Dec 1, 2023
Sold by
Chu Nellie H
Bought by
Jing 68 Parsons Llc
Current Estimated Value
Home Financials for this Owner
Home Financials are based on the most recent Mortgage that was taken out on this home.
Original Mortgage
$900,000
Outstanding Balance
$884,334
Interest Rate
7.76%
Mortgage Type
Purchase Money Mortgage
Estimated Equity
$560,552
Purchase Details
Closed on
Jul 19, 2007
Sold by
Tommy Li and Tommy Chor Kuen
Bought by
Chu Nellie H
Home Financials for this Owner
Home Financials are based on the most recent Mortgage that was taken out on this home.
Original Mortgage
$645,000
Interest Rate
6.73%
Mortgage Type
Purchase Money Mortgage
Purchase Details
Closed on
Dec 1, 2000
Sold by
Chen Judy Chui Yuk
Bought by
Li Chor Kuen
Purchase Details
Closed on
Jul 27, 1999
Sold by
Senno Pedro R and Senno Catalina
Bought by
Li Chor Kuen and Chuiyuk Judy
Home Financials for this Owner
Home Financials are based on the most recent Mortgage that was taken out on this home.
Original Mortgage
$238,000
Interest Rate
7.76%
Mortgage Type
Purchase Money Mortgage
Create a Home Valuation Report for This Property
The Home Valuation Report is an in-depth analysis detailing your home's value as well as a comparison with similar homes in the area
Home Values in the Area
Average Home Value in this Area
Purchase History
| Date | Buyer | Sale Price | Title Company |
|---|---|---|---|
| Jing 68 Parsons Llc | $1,399,000 | -- | |
| Jing 68 Parsons Llc | $1,399,000 | -- | |
| Jing 68 Parsons Llc | $1,399,000 | -- | |
| Chu Nellie H | $860,000 | -- | |
| Chu Nellie H | $860,000 | -- | |
| Li Chor Kuen | $73,000 | -- | |
| Li Chor Kuen | $73,000 | -- | |
| Li Chor Kuen | $408,000 | American Title Ins Co | |
| Li Chor Kuen | $408,000 | American Title Ins Co |
Source: Public Records
Mortgage History
| Date | Status | Borrower | Loan Amount |
|---|---|---|---|
| Open | Jing 68 Parsons Llc | $900,000 | |
| Closed | Jing 68 Parsons Llc | $900,000 | |
| Previous Owner | Chu Nellie H | $128,900 | |
| Previous Owner | Chu Nellie H | $645,000 | |
| Previous Owner | Li Chor Kuen | $238,000 |
Source: Public Records
Tax History Compared to Growth
Tax History
| Year | Tax Paid | Tax Assessment Tax Assessment Total Assessment is a certain percentage of the fair market value that is determined by local assessors to be the total taxable value of land and additions on the property. | Land | Improvement |
|---|---|---|---|---|
| 2025 | $10,595 | $55,915 | $14,764 | $41,151 |
| 2024 | $10,595 | $52,751 | $15,482 | $37,269 |
| 2023 | $10,171 | $50,640 | $14,475 | $36,165 |
| 2022 | $9,537 | $72,540 | $19,740 | $52,800 |
| 2021 | $10,054 | $63,300 | $19,740 | $43,560 |
| 2020 | $9,863 | $62,280 | $19,740 | $42,540 |
| 2019 | $9,196 | $66,960 | $19,740 | $47,220 |
| 2018 | $8,602 | $42,200 | $12,633 | $29,567 |
| 2017 | $8,116 | $39,812 | $13,687 | $26,125 |
| 2016 | $7,959 | $39,812 | $13,687 | $26,125 |
| 2015 | $4,530 | $38,830 | $18,409 | $20,421 |
| 2014 | $4,530 | $36,633 | $18,911 | $17,722 |
Source: Public Records
Map
Nearby Homes
- 148-11 Kalmia Ave
- 148-24 Kalmia Ave
- 14824 Kalmia Ave
- 148-10 Kalmia Ave
- 148-29 Laburnum Ave
- 46-43 157th St
- 157-18 Laburnum Ave
- 43-45 Burling St
- 46-05 158th St
- 45-57 157th St
- 143-16 Holly Ave
- 149-27 45th Ave
- 14335 Poplar Ave
- 149-31 45th Ave
- 45-24 Burling St
- 45-11 157th St
- 157-51 Rose Ave
- 4530 Smart St
- 4620 161st St Unit B2
- 46-12 161st St Unit 1D
- 46-63 Parsons Blvd
- 14810 Kalmia Ave
- 4667 Parsons Blvd
- 46-67 Parsons Blvd
- 14814 Kalmia Ave
- 4655 Parsons Blvd
- 14820 Kalmia Ave
- 14820 Kalmia Ave
- 4671 Parsons Blvd
- 4671 Parsons Blvd
- 14807 Laburnum Ave
- 48-05 Parsons Blvd
- 4658 Parsons Blvd
- 0 Laburnum Ave
- 4662 Parsons Blvd
- 47-09 Parsons Blvd
- 4654 Parsons Blvd
- 14815 Laburnum Ave
- 46-58 Parsons Blvd
- 4654 Parsons Blvd