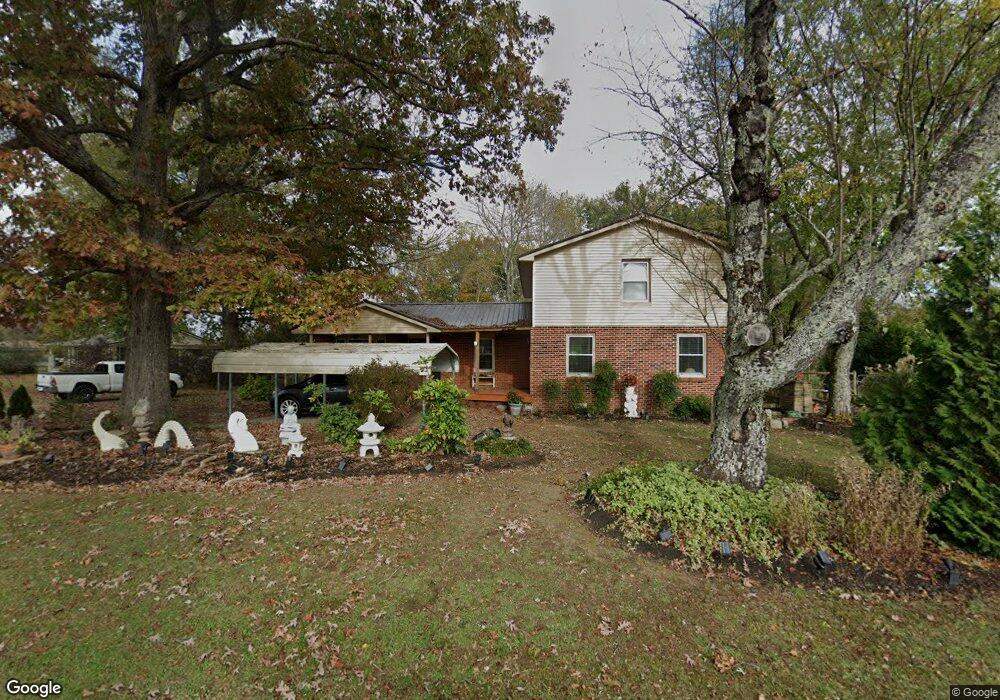
4664 Old Tullahoma Rd Winchester, TN 37398
Estimated Value: $271,000 - $607,000
--
Bed
2
Baths
2,613
Sq Ft
$153/Sq Ft
Est. Value
About This Home
This home is located at 4664 Old Tullahoma Rd, Winchester, TN 37398 and is currently estimated at $398,998, approximately $152 per square foot. 4664 Old Tullahoma Rd is a home located in Franklin County with nearby schools including North Middle School, Franklin County High School, and Winchester Christian Academy.
Ownership History
Date
Name
Owned For
Owner Type
Purchase Details
Closed on
Jul 31, 2012
Sold by
Hulsey Katy Kelley
Bought by
Watts Gallie and Watts Rosa L
Current Estimated Value
Purchase Details
Closed on
Jun 20, 2012
Sold by
Hulsey Katy Kelley
Bought by
Hulsey Katy Kelley
Purchase Details
Closed on
Sep 15, 2010
Sold by
Brown William
Bought by
Brown Joyce
Purchase Details
Closed on
Jul 2, 2007
Sold by
Sunderland William S
Bought by
Jackson Jeanette
Purchase Details
Closed on
Jan 15, 2003
Sold by
Sunderland William
Bought by
Jackson Jeanette
Purchase Details
Closed on
Oct 10, 2002
Sold by
Baker Jeanette W
Bought by
Sunderland Bill
Purchase Details
Closed on
May 29, 2002
Sold by
Vanjim M
Bought by
Vann Jim M
Purchase Details
Closed on
May 8, 1996
Sold by
Morris Agnes Stephens L E
Bought by
Skoog Ann
Purchase Details
Closed on
Sep 27, 1990
Bought by
Morris Agnes Stephens L and Morris E
Purchase Details
Closed on
May 5, 1972
Bought by
Morris Agnes Stephens
Create a Home Valuation Report for This Property
The Home Valuation Report is an in-depth analysis detailing your home's value as well as a comparison with similar homes in the area
Home Values in the Area
Average Home Value in this Area
Purchase History
| Date | Buyer | Sale Price | Title Company |
|---|---|---|---|
| Watts Gallie | $10,000 | -- | |
| Hulsey Katy Kelley | -- | -- | |
| Brown Joyce | -- | -- | |
| Jackson Jeanette | -- | -- | |
| Jackson Jeanette | $3,022 | -- | |
| Sunderland Bill | $30,000 | -- | |
| Vann Jim M | -- | -- | |
| Skoog Ann | $29,900 | -- | |
| Morris Agnes Stephens L | -- | -- | |
| Morris Agnes Stephens | -- | -- |
Source: Public Records
Tax History Compared to Growth
Tax History
| Year | Tax Paid | Tax Assessment Tax Assessment Total Assessment is a certain percentage of the fair market value that is determined by local assessors to be the total taxable value of land and additions on the property. | Land | Improvement |
|---|---|---|---|---|
| 2024 | $1,167 | $58,500 | $4,425 | $54,075 |
| 2023 | $1,157 | $58,000 | $4,425 | $53,575 |
| 2022 | $1,088 | $58,000 | $4,425 | $53,575 |
| 2021 | $954 | $58,000 | $4,425 | $53,575 |
| 2020 | $954 | $33,125 | $4,100 | $29,025 |
| 2019 | $954 | $33,125 | $4,100 | $29,025 |
| 2018 | $886 | $33,125 | $4,100 | $29,025 |
| 2017 | $886 | $33,125 | $4,100 | $29,025 |
| 2016 | $796 | $29,775 | $3,025 | $26,750 |
| 2015 | $796 | $29,775 | $3,025 | $26,750 |
| 2014 | $796 | $29,763 | $0 | $0 |
Source: Public Records
Map
Nearby Homes
- 74 Pine Bluff Rd
- 0 Cooper Ln
- 28 Old Eastbrook Rd
- 0 Old Tullahoma Rd Unit RTC2967846
- 0 Old Tullahoma Rd Unit RTC2967837
- 0 Old Tullahoma Rd Unit RTC2967835
- 369 Old Eastbrook Rd
- 265 Shasteen Bend Dr
- 0 Old Tullahoma Rd Unit RTC2823177
- 423 Shasteen Bend Dr
- 0 Little Hurricane Rd
- 60 Lees Ford Ln
- 1840 Lockmiller Rd
- 54 Foyer Dr
- 263 Riva Lake Rd
- 235 Lakeview St
- 0 Maple Bend Rd
- 947 Fanning Bend Dr
- FB 175 Plan at Fanning Bend
- FB 217 Plan at Fanning Bend
- 4694 Old Tullahoma Rd
- 4 Pine Bluff Rd
- 6 Pine Bluff Rd
- 4620 Old Tullahoma Rd
- 4729 Old Tullahoma Rd
- 4582 Old Tullahoma Rd
- 209 Pine Bluff Rd
- 56 Pine Bluff Rd
- 4561 Old Tullahoma Rd
- 4536 Old Tullahoma Rd
- 114 Meaker Ln
- 90 Pine Bluff Rd
- 106 Pine Bluff Rd
- 151 Harris Chapel Dr
- 104 Meaker Ln
- 4506 Old Tullahoma Rd
- 4820 Old Tullahoma Rd
- 70 Meaker Ln
- 124 Pine Bluff Rd
- 4815 Old Tullahoma Rd