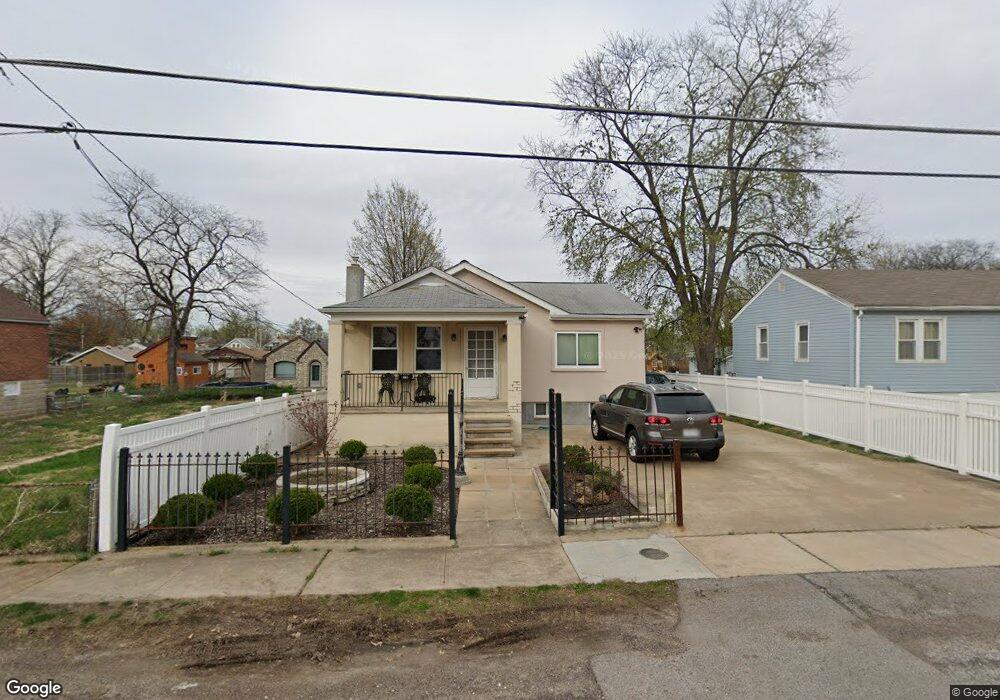
4665 Tiemann Ave Saint Louis, MO 63123
Lemay NeighborhoodEstimated Value: $122,000 - $173,672
1
Bed
1
Bath
592
Sq Ft
$259/Sq Ft
Est. Value
About This Home
This home is located at 4665 Tiemann Ave, Saint Louis, MO 63123 and is currently estimated at $153,418, approximately $259 per square foot. 4665 Tiemann Ave is a home located in St. Louis County with nearby schools including Bayless Elementary School, Bayless Junior High School, and Bayless Senior High School.
Ownership History
Date
Name
Owned For
Owner Type
Purchase Details
Closed on
Aug 8, 2014
Sold by
Sisic Nesib and Sisic Samija
Bought by
Sisic Alija
Current Estimated Value
Purchase Details
Closed on
Jun 11, 2009
Sold by
Mortgage One Corporation
Bought by
Sisic Nesib and Sisic Samija
Purchase Details
Closed on
Apr 9, 2009
Sold by
Israel Jeffrey E and Israel Pamela M
Bought by
Mortgage One Corporation and Mortgage Corporation
Purchase Details
Closed on
Mar 26, 1999
Sold by
Israel Pamela and Israel Jeffrey
Bought by
Israel Jeffrey and Israel Pamela
Home Financials for this Owner
Home Financials are based on the most recent Mortgage that was taken out on this home.
Original Mortgage
$36,700
Interest Rate
6.69%
Purchase Details
Closed on
Jul 15, 1997
Sold by
Solomon Mary Ellen
Bought by
Stroud Pamela
Home Financials for this Owner
Home Financials are based on the most recent Mortgage that was taken out on this home.
Original Mortgage
$15,050
Interest Rate
7.72%
Create a Home Valuation Report for This Property
The Home Valuation Report is an in-depth analysis detailing your home's value as well as a comparison with similar homes in the area
Home Values in the Area
Average Home Value in this Area
Purchase History
| Date | Buyer | Sale Price | Title Company |
|---|---|---|---|
| Sisic Alija | -- | None Available | |
| Sisic Nesib | $31,200 | Us Title North | |
| Mortgage One Corporation | $49,276 | None Available | |
| Israel Jeffrey | -- | -- | |
| Stroud Pamela | -- | Nations Title Agency Inc |
Source: Public Records
Mortgage History
| Date | Status | Borrower | Loan Amount |
|---|---|---|---|
| Previous Owner | Israel Jeffrey | $36,700 | |
| Previous Owner | Stroud Pamela | $15,050 |
Source: Public Records
Tax History Compared to Growth
Tax History
| Year | Tax Paid | Tax Assessment Tax Assessment Total Assessment is a certain percentage of the fair market value that is determined by local assessors to be the total taxable value of land and additions on the property. | Land | Improvement |
|---|---|---|---|---|
| 2025 | $2,011 | $30,840 | $14,840 | $16,000 |
| 2024 | $2,011 | $27,760 | $7,410 | $20,350 |
| 2023 | $1,979 | $27,760 | $7,410 | $20,350 |
| 2022 | $1,838 | $23,270 | $8,470 | $14,800 |
| 2021 | $1,790 | $23,270 | $8,470 | $14,800 |
| 2020 | $1,833 | $22,080 | $8,040 | $14,040 |
| 2019 | $1,828 | $22,080 | $8,040 | $14,040 |
| 2018 | $1,476 | $15,750 | $6,970 | $8,780 |
| 2017 | $1,387 | $15,750 | $6,970 | $8,780 |
| 2016 | $1,221 | $13,600 | $3,360 | $10,240 |
| 2015 | $1,215 | $13,600 | $3,360 | $10,240 |
| 2014 | -- | $21,150 | $5,550 | $15,600 |
Source: Public Records
Map
Nearby Homes
- 4700 Stone Ave
- 4704 Stone Ave
- 4530 Grasso Ave
- 4739 Heege Rd
- 4760 Stone Ave
- 4606 Heege Rd
- 4758 Heidelberg Ave
- 4834 Heidelberg Ave
- 4338 Seibert Ave
- 8120 Parkridge Dr
- 4825 Oldenburg Ave
- 4955 Seibert Ave
- 7910 Gravois Rd
- 8015 Carlsbad Dr
- 8009 Gravois Rd
- 4409 Fatima Dr
- 8706 Fatima Dr
- 4671 Tesson St
- 8911 Kammerer Ave
- 4639 Primm St
- 4663 Tiemann Ave
- 4667 Tiemann Ave
- 4669 Tiemann Ave
- 4671 Tiemann Ave
- 4655 Tiemann Ave
- 4651 Tiemann Ave
- 4660 Tiemann Ave
- 4666 Tiemann Ave
- 4652 Tiemann Ave
- 4650 Tiemann Ave
- 4645 Tiemann Ave
- 7928 Hildesheim Ave
- 4670 Tiemann Ave
- 7930 Hildesheim Ave
- 7926 Hildesheim Ave
- 7922 Hildesheim Ave
- 4644 Tiemann Ave
- 4641 Tiemann Ave
- 7920 Hildesheim Ave
- 4658 Heidelberg Ave