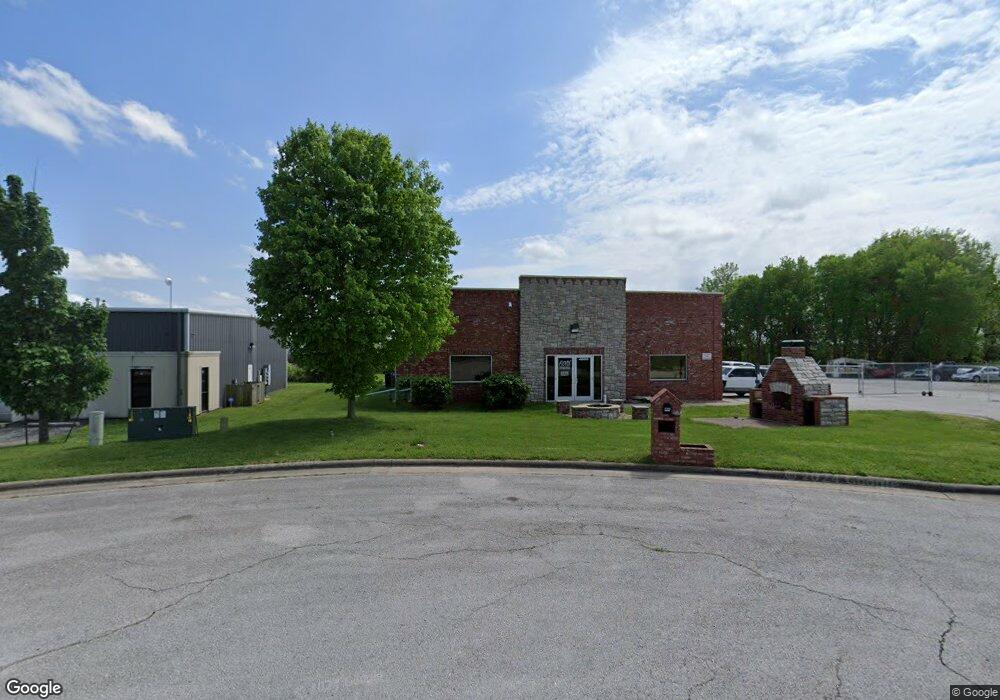
4666 Pfeiffer Ct Springfield, MO 65803
Estimated Value: $449,207
Studio
--
Bath
4,068
Sq Ft
$110/Sq Ft
Est. Value
About This Home
This home is located at 4666 Pfeiffer Ct, Springfield, MO 65803 and is currently estimated at $449,207, approximately $110 per square foot. 4666 Pfeiffer Ct is a home located in Greene County with nearby schools including Willard Central Elementary School and Willard Intermediate School North.
Ownership History
Date
Name
Owned For
Owner Type
Purchase Details
Closed on
Jun 22, 2018
Sold by
Rosales Holdings Llc
Bought by
Floyd S Wrecker Service Llc
Current Estimated Value
Home Financials for this Owner
Home Financials are based on the most recent Mortgage that was taken out on this home.
Original Mortgage
$195,200
Outstanding Balance
$168,459
Interest Rate
4.5%
Mortgage Type
FHA
Estimated Equity
$280,748
Purchase Details
Closed on
May 27, 2011
Sold by
Rosales Nazario and Rosales April
Bought by
Rosales Holding Llc
Purchase Details
Closed on
Jun 21, 2006
Sold by
Todd James Eugene
Bought by
Rosales Nazario and Rosales April
Home Financials for this Owner
Home Financials are based on the most recent Mortgage that was taken out on this home.
Original Mortgage
$57,675
Interest Rate
6.63%
Mortgage Type
New Conventional
Create a Home Valuation Report for This Property
The Home Valuation Report is an in-depth analysis detailing your home's value as well as a comparison with similar homes in the area
Purchase History
| Date | Buyer | Sale Price | Title Company |
|---|---|---|---|
| Floyd S Wrecker Service Llc | -- | None Available | |
| Rosales Holding Llc | -- | None Available | |
| Rosales Nazario | -- | None Available |
Source: Public Records
Mortgage History
| Date | Status | Borrower | Loan Amount |
|---|---|---|---|
| Open | Floyd S Wrecker Service Llc | $195,200 | |
| Previous Owner | Rosales Nazario | $57,675 |
Source: Public Records
Tax History
| Year | Tax Paid | Tax Assessment Tax Assessment Total Assessment is a certain percentage of the fair market value that is determined by local assessors to be the total taxable value of land and additions on the property. | Land | Improvement |
|---|---|---|---|---|
| 2025 | -- | $87,910 | $21,250 | $66,660 |
| 2024 | -- | $81,440 | $21,250 | $60,190 |
| 2023 | $0 | $81,440 | $21,250 | $60,190 |
| 2022 | $5,008 | $76,420 | $21,250 | $55,170 |
| 2021 | $5,009 | $76,420 | $21,250 | $55,170 |
| 2020 | $5,053 | $76,480 | $21,250 | $55,230 |
| 2019 | $5,034 | $76,480 | $21,250 | $55,230 |
| 2018 | $5,055 | $93,250 | $21,250 | $72,000 |
| 2017 | $6,119 | $92,100 | $21,250 | $70,850 |
| 2016 | $6,017 | $92,100 | $21,250 | $70,850 |
| 2015 | $5,979 | $92,100 | $21,250 | $70,850 |
| 2014 | $5,661 | $86,720 | $21,250 | $65,470 |
Source: Public Records
Map
Nearby Homes
- 4620 W Willard Rd
- 4107 W Kearney St
- 2541 N Eldon Ave
- 5589 W Farm Road 104
- 3468 W Hestand St
- 3467 W Hestand St
- 3443 W Hestand St
- 3952 W Collings St
- 3340 W Bellaire St
- 2940 N Nixon Ave
- 3486 N Ohara Ave
- 3272 N Ohara Ave
- 000 N Farm Road 127
- 3229 W McClernon St
- 1311 N Dawn Ave
- 6307 W Cottonwood Rd
- 6208 W State Highway Ee
- 6334 Crystal Ln W
- 2571 N Honeysuckle Way
- 2600 N Wildberry Ct
- 4648 Pfeiffer Ct
- 4656 Pfeiffer Ct
- 4640 W Willard Rd
- 4640 W Willard Rd
- 4611 N Willard Rd
- 4630 W Willard Rd
- 0 W Willard Rd Unit 11012306
- 2749 N General Aviation Ave Unit A
- 4615 W Willard Rd
- 4655 W Kearney St
- 2904 N Farm Road 123
- 0 N Westgate Ave Unit 60108161
- 0 N Westgate Ave Unit 60133450
- 3818 N Farm Road 123
- 4646 W Kearney St
- 4656 W Kearney St
- 3083 N Farm Road 123
- 4700 W Kearney St
- 3117 N Farm Road 123
- 2308 N Linro Ln
Your Personal Tour Guide
Ask me questions while you tour the home.