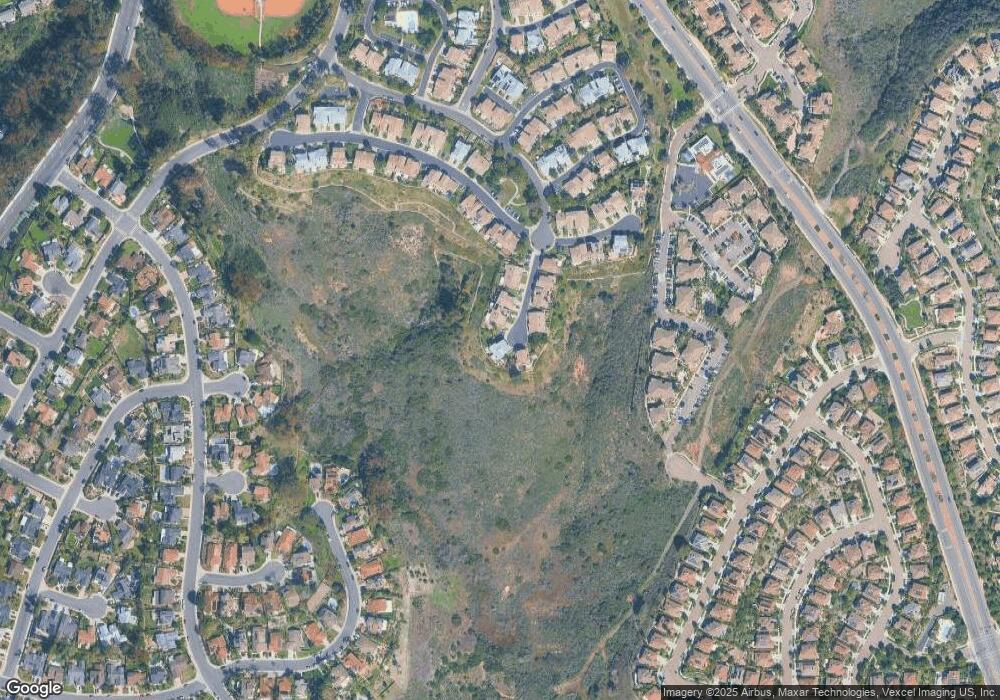
4667 Woodstock St Carlsbad, CA 92010
Calavera Hills NeighborhoodEstimated Value: $1,099,000 - $1,368,000
4
Beds
3
Baths
1,724
Sq Ft
$722/Sq Ft
Est. Value
About This Home
This home is located at 4667 Woodstock St, Carlsbad, CA 92010 and is currently estimated at $1,243,894, approximately $721 per square foot. 4667 Woodstock St is a home located in San Diego County with nearby schools including Hope Elementary School, Calavera Hills Middle, and Sage Creek High.
Ownership History
Date
Name
Owned For
Owner Type
Purchase Details
Closed on
Sep 13, 2002
Sold by
Flagg E Thomas and Flagg Janice A
Bought by
Flagg E Thomas and Flagg Janice A
Current Estimated Value
Purchase Details
Closed on
Jun 27, 1984
Create a Home Valuation Report for This Property
The Home Valuation Report is an in-depth analysis detailing your home's value as well as a comparison with similar homes in the area
Home Values in the Area
Average Home Value in this Area
Purchase History
| Date | Buyer | Sale Price | Title Company |
|---|---|---|---|
| Flagg E Thomas | -- | -- | |
| -- | $108,000 | -- |
Source: Public Records
Tax History Compared to Growth
Tax History
| Year | Tax Paid | Tax Assessment Tax Assessment Total Assessment is a certain percentage of the fair market value that is determined by local assessors to be the total taxable value of land and additions on the property. | Land | Improvement |
|---|---|---|---|---|
| 2025 | $6,272 | $597,399 | $362,061 | $235,338 |
| 2024 | $6,272 | $585,686 | $354,962 | $230,724 |
| 2023 | $6,240 | $574,202 | $348,002 | $226,200 |
| 2022 | $6,143 | $562,944 | $341,179 | $221,765 |
| 2021 | $6,097 | $551,907 | $334,490 | $217,417 |
| 2020 | $6,056 | $546,249 | $331,061 | $215,188 |
| 2019 | $5,947 | $535,539 | $324,570 | $210,969 |
| 2018 | $5,696 | $525,039 | $318,206 | $206,833 |
| 2017 | $5,601 | $514,745 | $311,967 | $202,778 |
| 2016 | $4,957 | $465,000 | $280,000 | $185,000 |
| 2015 | $4,798 | $445,000 | $268,000 | $177,000 |
| 2014 | $4,565 | $422,000 | $255,000 | $167,000 |
Source: Public Records
Map
Nearby Homes
- 2957 Lexington Cir
- 4772 Gateshead Rd
- 4537 Hartford Place
- 3444 Moon Field Dr
- 3461 Rich Field Dr
- 3474 Rich Field Dr
- 3619 N Fork Ave
- 4375 Stanford St
- 2880 Englewood Way
- 3753 Bergen Peak Place
- 2935 Cliff Cir Unit 33
- 4583 Chancery Ct
- 3669 Strata Dr
- 2683 Coventry Rd
- 3019 Glenbrook St
- 4350 Point Reyes Ct
- 3498 Harwich Dr
- 5459 Don Felipe Dr Unit 485
- 3438 Don Alberto Dr Unit 434
- 3445 Don Ortega Dr
- 4669 Woodstock St
- 4663 Woodstock St
- 4670 Woodstock St
- 4661 Woodstock St
- 4668 Woodstock St
- 4659 Woodstock St
- 4664 Woodstock St
- 4657 Woodstock St
- 4662 Woodstock St
- 4653 Woodstock St
- 4658 Woodstock St
- 4656 Woodstock St
- 4651 Woodstock St
- 4654 Woodstock St
- 4652 Woodstock St
- 4650 Woodstock St
- 2945 Lancaster Rd
- 4648 Woodstock St
- 2941 Lancaster Rd
- 2939 Lancaster Rd
