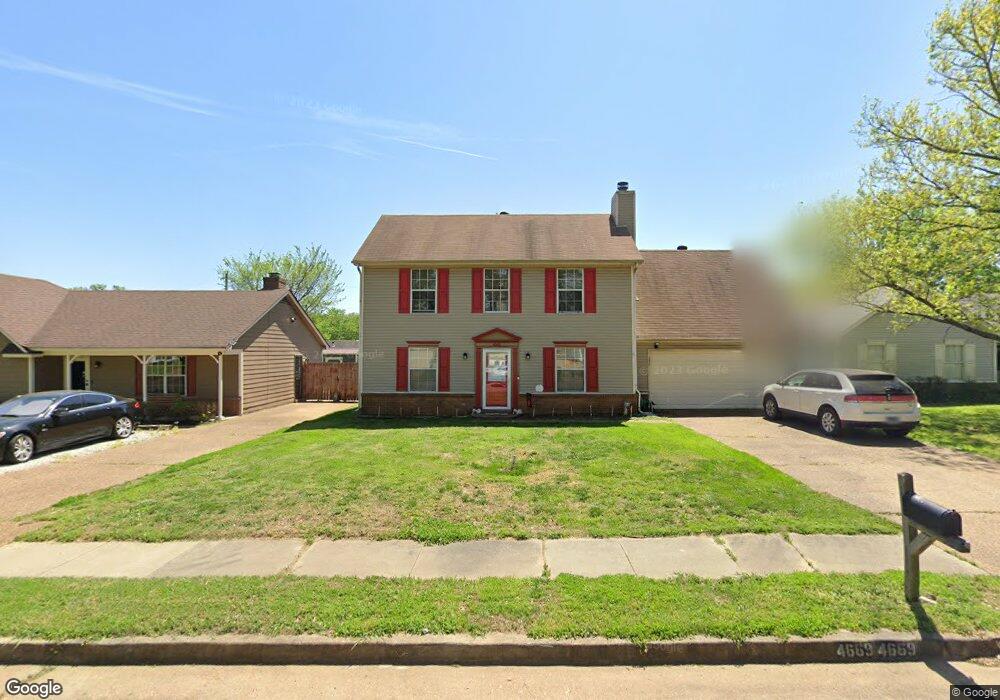
4669 Crestfield Rd Millington, TN 38053
Estimated Value: $207,000 - $225,000
4
Beds
2
Baths
1,930
Sq Ft
$111/Sq Ft
Est. Value
About This Home
This home is located at 4669 Crestfield Rd, Millington, TN 38053 and is currently estimated at $214,454, approximately $111 per square foot. 4669 Crestfield Rd is a home located in Shelby County with nearby schools including Lucy Elementary School, Woodstock Middle School, and Bolton High School.
Ownership History
Date
Name
Owned For
Owner Type
Purchase Details
Closed on
Sep 8, 2022
Sold by
Smith Debra L
Bought by
Smith Debra L and Henry Dierdra L
Current Estimated Value
Purchase Details
Closed on
Mar 31, 2008
Sold by
Schorr Alice L Gordon
Bought by
Smith Debra L
Home Financials for this Owner
Home Financials are based on the most recent Mortgage that was taken out on this home.
Original Mortgage
$118,047
Interest Rate
5.97%
Mortgage Type
FHA
Purchase Details
Closed on
May 18, 1998
Sold by
Schorr Jacob B
Bought by
Schorr Alice L Gordon
Home Financials for this Owner
Home Financials are based on the most recent Mortgage that was taken out on this home.
Original Mortgage
$82,275
Interest Rate
6.77%
Purchase Details
Closed on
Apr 30, 1996
Sold by
Kennin Karl
Bought by
Schorr Jacob B and Schorr Alice L Gordon
Home Financials for this Owner
Home Financials are based on the most recent Mortgage that was taken out on this home.
Original Mortgage
$82,924
Interest Rate
7.77%
Mortgage Type
FHA
Create a Home Valuation Report for This Property
The Home Valuation Report is an in-depth analysis detailing your home's value as well as a comparison with similar homes in the area
Home Values in the Area
Average Home Value in this Area
Purchase History
| Date | Buyer | Sale Price | Title Company |
|---|---|---|---|
| Smith Debra L | -- | None Listed On Document | |
| Smith Debra L | $119,900 | None Available | |
| Schorr Alice L Gordon | -- | -- | |
| Schorr Jacob B | $85,000 | -- |
Source: Public Records
Mortgage History
| Date | Status | Borrower | Loan Amount |
|---|---|---|---|
| Previous Owner | Smith Debra L | $118,047 | |
| Previous Owner | Schorr Alice L Gordon | $82,275 | |
| Previous Owner | Schorr Jacob B | $82,924 |
Source: Public Records
Tax History Compared to Growth
Tax History
| Year | Tax Paid | Tax Assessment Tax Assessment Total Assessment is a certain percentage of the fair market value that is determined by local assessors to be the total taxable value of land and additions on the property. | Land | Improvement |
|---|---|---|---|---|
| 2025 | $1,013 | $50,900 | $5,000 | $45,900 |
| 2024 | $1,013 | $29,875 | $3,725 | $26,150 |
| 2023 | $1,013 | $29,875 | $3,725 | $26,150 |
| 2022 | $1,013 | $29,875 | $3,725 | $26,150 |
| 2021 | $1,031 | $29,875 | $3,725 | $26,150 |
| 2020 | $883 | $21,800 | $3,725 | $18,075 |
| 2019 | $883 | $21,800 | $3,725 | $18,075 |
| 2018 | $883 | $21,800 | $3,725 | $18,075 |
| 2017 | $896 | $21,800 | $3,725 | $18,075 |
| 2016 | $896 | $20,500 | $0 | $0 |
| 2014 | $896 | $20,500 | $0 | $0 |
Source: Public Records
Map
Nearby Homes
- 4551 Waverly Farms Rd
- 5975 Prairie Cove
- 4392 Ridge Bay Cove
- 4428 Duncan Rd
- 4385 Ridge Bay Cove
- 6866 Basun Cir E
- 4578 Basun Cir E
- 4140 Pleasant Ridge Rd
- 4600 Goldsby Place
- 4235 Sykes Rd
- 4703 Cedar Rose Dr
- 4531 Basun Cir S
- 4527 Basun Cir S
- 4537 Basun Cir S
- 3545 Lucy Rd
- 7266 Raleigh Millington Rd
- 7011 Alder Wood Dr
- 4315 Peach Run Lane Ln
- 4288 Peach Run Lane Ln
- 4302 Peach Run Lane Ln
- 4675 Crestfield Rd
- 4655 Crestfield Rd
- 4660 Tumblebrook Cove
- 4668 Tumblebrook Cove
- 4685 Crestfield Rd
- 4664 Crestfield Rd
- 6031 Oak Glen Cove
- 4678 Crestfield Rd
- 4645 Crestfield Rd
- 4654 Tumblebrook Cove
- 4660 Crestfield Rd
- 4684 Crestfield Rd
- 4652 Crestfield Rd
- 4635 Crestfield Rd
- 4690 Crestfield Rd
- 6044 Holly Heights Cove
- 6025 Oak Glen Cove
- 4655 Tumblebrook Cove
- 4625 Crestfield Rd
- 4686 Tumblebrook Cove