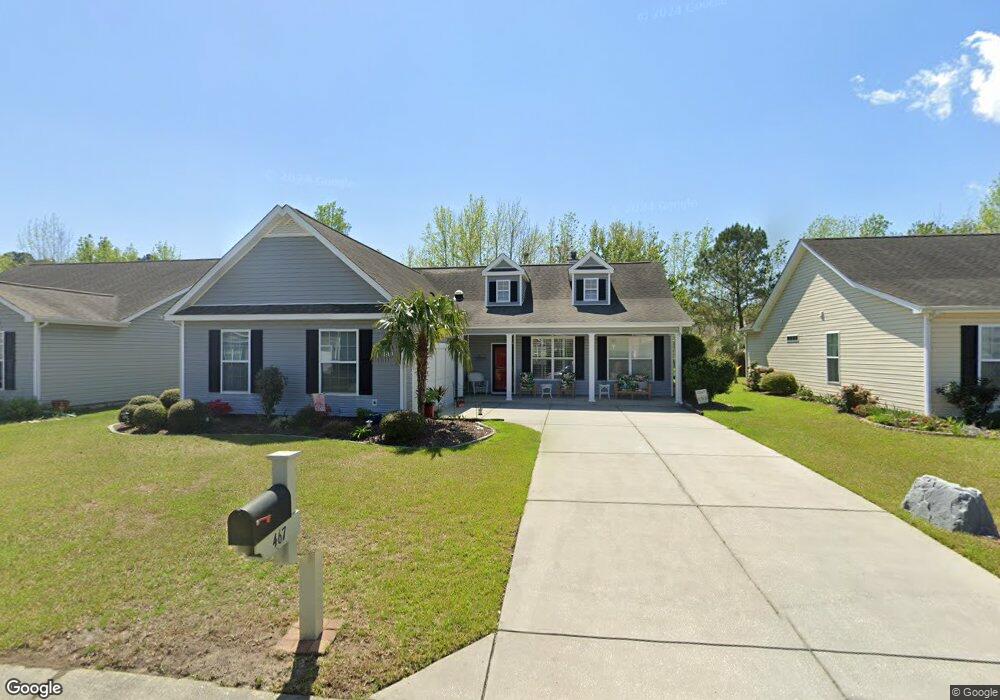
467 Slippery Rock Way Unit lot 496;phase 10 Calabash, NC 28467
Estimated Value: $322,000 - $421,000
3
Beds
2
Baths
2,200
Sq Ft
$160/Sq Ft
Est. Value
About This Home
This home is located at 467 Slippery Rock Way Unit lot 496;phase 10, Calabash, NC 28467 and is currently estimated at $353,021, approximately $160 per square foot. 467 Slippery Rock Way Unit lot 496;phase 10 is a home located in Brunswick County with nearby schools including Jessie Mae Monroe Elementary School, Shallotte Middle School, and West Brunswick High School.
Ownership History
Date
Name
Owned For
Owner Type
Purchase Details
Closed on
Oct 31, 2023
Sold by
Kosmowski Timothy J and Kosmowski Robin A
Bought by
Daniel Charles Edwas and Daniel Deborah M
Current Estimated Value
Home Financials for this Owner
Home Financials are based on the most recent Mortgage that was taken out on this home.
Original Mortgage
$359,000
Outstanding Balance
$349,083
Interest Rate
5%
Mortgage Type
VA
Estimated Equity
$3,938
Purchase Details
Closed on
Jan 26, 2022
Sold by
Hawthorn Barbara J
Bought by
Kosmowski Timothy J and Kosmowski Robin A
Purchase Details
Closed on
Aug 27, 2020
Sold by
Sahol Edward Michael
Bought by
Hawthorn Barbara J
Purchase Details
Closed on
May 29, 2009
Sold by
D R Horton Inc
Bought by
Hawthorn Barbara J
Create a Home Valuation Report for This Property
The Home Valuation Report is an in-depth analysis detailing your home's value as well as a comparison with similar homes in the area
Home Values in the Area
Average Home Value in this Area
Purchase History
| Date | Buyer | Sale Price | Title Company |
|---|---|---|---|
| Daniel Charles Edwas | $359,000 | None Listed On Document | |
| Kosmowski Timothy J | $315,000 | None Listed On Document | |
| Hawthorn Barbara J | -- | None Available | |
| Hawthorn Barbara J | -- | None Available | |
| Hawthorn Barbara J | $205,000 | None Available |
Source: Public Records
Mortgage History
| Date | Status | Borrower | Loan Amount |
|---|---|---|---|
| Open | Daniel Charles Edwas | $359,000 |
Source: Public Records
Tax History Compared to Growth
Tax History
| Year | Tax Paid | Tax Assessment Tax Assessment Total Assessment is a certain percentage of the fair market value that is determined by local assessors to be the total taxable value of land and additions on the property. | Land | Improvement |
|---|---|---|---|---|
| 2025 | $1,611 | $319,180 | $40,000 | $279,180 |
| 2024 | $1,611 | $319,180 | $40,000 | $279,180 |
| 2023 | $1,392 | $319,180 | $40,000 | $279,180 |
| 2022 | $1,392 | $203,240 | $25,000 | $178,240 |
| 2021 | $1,392 | $203,240 | $25,000 | $178,240 |
| 2020 | $1,348 | $203,240 | $25,000 | $178,240 |
| 2019 | $1,348 | $27,160 | $25,000 | $2,160 |
| 2018 | $1,246 | $27,530 | $25,000 | $2,530 |
| 2017 | $1,246 | $27,530 | $25,000 | $2,530 |
| 2016 | $1,221 | $27,530 | $25,000 | $2,530 |
| 2015 | $1,221 | $191,040 | $25,000 | $166,040 |
| 2014 | $1,112 | $186,005 | $25,000 | $161,005 |
Source: Public Records
Map
Nearby Homes
- 465 Slippery Rock Way
- 470 Slippery Rock Way
- 850 Meadow Ln SW
- 498 Slippery Rock Way
- 504 Slippery Rock Way
- 12 Calabash Lakes Blvd
- 3023 Cedar Creek Ln
- 94 Field Planters Cir Unit 94
- 94 Field Planters Cir
- 90 Field Planters Cir
- 3070 Crescent Lake Dr
- 558 Tullimore Ln NW
- 1015 Coleto Creek Ln
- 8934 Chesterfield Dr NW
- 73 Field Planters Cir Unit 73
- 73 Field Planters Cir
- 1071 Chadsey Lake Dr
- 1069 Chadsey Lake Dr
- 7 Cattle Run Ln
- 1339 Sunny Slope Cir
- 467 Slippery Rock Way
- 467 Slippery Rock Way Unit 496
- 469 Slippery Rock Way
- 469 Slippery Rock Way Unit LOT 497; PHASE 10
- 469 Slippery Rock Way Unit 497
- 465 Slippery Rock Way Unit LOT 495; PHASE 10
- 465 Slippery Rock Way Unit 495
- 471 Slippery Rock Way
- 471 Slippery Rock Way Unit LOT 498; PHASE 10
- 471 Slippery Rock Way Unit The Farm at Brunswic
- 463 Slippery Rock Way
- 468 Slippery Rock Way
- 468 Slippery Rock Way Unit Lot 480, Phase 10
- 468 Slippery Rock Way Unit 480
- 470 Slippery Rock Way Unit LOT 479; PHASE 10
- 470 Slippery Rock Way Unit 479
- 466 Slippery Rock Way
- 466 Slippery Rock Way Unit lot 481; phase 10
- 466 Slippery Rock Way Unit 481
- 473 Slippery Rock Way