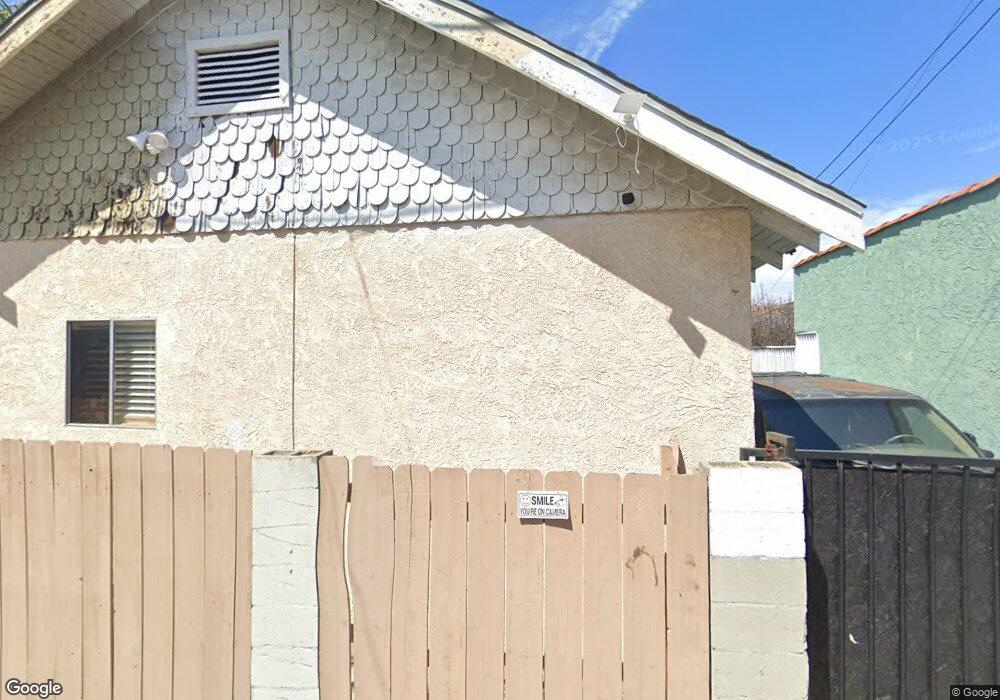
467 W 11th St San Pedro, CA 90731
Estimated Value: $666,112 - $722,000
2
Beds
1
Bath
840
Sq Ft
$822/Sq Ft
Est. Value
About This Home
This home is located at 467 W 11th St, San Pedro, CA 90731 and is currently estimated at $690,528, approximately $822 per square foot. 467 W 11th St is a home located in Los Angeles County with nearby schools including Fifteenth Street Elementary School, Dana Middle School, and San Pedro Senior High School.
Ownership History
Date
Name
Owned For
Owner Type
Purchase Details
Closed on
Dec 20, 2017
Sold by
Ungaro John and Ungaro John Anthony
Bought by
Ungaro John and Ungaro Valerie
Current Estimated Value
Purchase Details
Closed on
Nov 27, 2017
Sold by
Ungaro Henry V
Bought by
Ungaro Henry V and Ungaro Rosalva
Purchase Details
Closed on
Nov 17, 2017
Sold by
Ungaro Michael T and Ungaro Anita
Bought by
Ungaro Michael T and Ungaro Anita
Purchase Details
Closed on
Oct 18, 2017
Sold by
Ungaro Jennifer Marie
Bought by
Ungaro Jennifer Marie and Jennifer Marie Ungaro Family T
Purchase Details
Closed on
May 11, 2001
Sold by
Nizich Robert W and Nizich Darin L
Bought by
Nizich Robert William and Nizich Darin Lee
Purchase Details
Closed on
Jul 20, 1995
Sold by
Ungaro Henry G and Ungaro Marie T
Bought by
Ungaro Henry Gerald and Ungaro Marie T
Purchase Details
Closed on
Jul 18, 1995
Sold by
Amalfitano Thomas
Bought by
Amalfitano Thomas C and Thomas C Amalfitano Inter Vivo
Create a Home Valuation Report for This Property
The Home Valuation Report is an in-depth analysis detailing your home's value as well as a comparison with similar homes in the area
Home Values in the Area
Average Home Value in this Area
Purchase History
| Date | Buyer | Sale Price | Title Company |
|---|---|---|---|
| Ungaro John | -- | None Available | |
| Ungaro Henry V | -- | None Available | |
| Ungaro Michael T | -- | None Available | |
| Ungaro Michael T | -- | None Available | |
| Ungaro Michael Thomas | -- | None Available | |
| Ungaro Jennifer Marie | -- | None Available | |
| Nizich Robert William | -- | -- | |
| Ungaro Henry Gerald | -- | -- | |
| Amalfitano Thomas C | -- | -- |
Source: Public Records
Tax History Compared to Growth
Tax History
| Year | Tax Paid | Tax Assessment Tax Assessment Total Assessment is a certain percentage of the fair market value that is determined by local assessors to be the total taxable value of land and additions on the property. | Land | Improvement |
|---|---|---|---|---|
| 2025 | $3,366 | $270,532 | $229,969 | $40,563 |
| 2024 | $3,366 | $265,228 | $225,460 | $39,768 |
| 2023 | $3,302 | $260,029 | $221,040 | $38,989 |
| 2022 | $3,150 | $254,931 | $216,706 | $38,225 |
| 2021 | $3,109 | $249,933 | $212,457 | $37,476 |
| 2020 | $3,138 | $247,371 | $210,279 | $37,092 |
| 2019 | $3,017 | $242,521 | $206,156 | $36,365 |
| 2018 | $2,967 | $237,766 | $202,114 | $35,652 |
| 2017 | $2,901 | $233,104 | $198,151 | $34,953 |
| 2016 | $2,831 | $228,534 | $194,266 | $34,268 |
| 2015 | $2,790 | $225,102 | $191,348 | $33,754 |
| 2014 | $2,790 | $220,693 | $187,600 | $33,093 |
Source: Public Records
Map
Nearby Homes
- 467 W 12th St
- 362 W 11th St
- 902 S Mesa St
- 576 W 11th St
- 457 W 13th St
- 1309 S Mesa St
- 343 W 12th St
- 576 W 13th St
- 1209 S Grand Ave Unit 1211
- 573 W 13th St
- 1316 S Grand Ave
- 1311 S Grand Ave Unit 5
- 1311 S Grand Ave Unit 17
- 285 W 9th St
- 252 W 11th St
- 620 W 8th St
- 649 W 8th St
- 221 W 10th St
- 637 S Grand Ave Unit 4
- 728 W 11th St