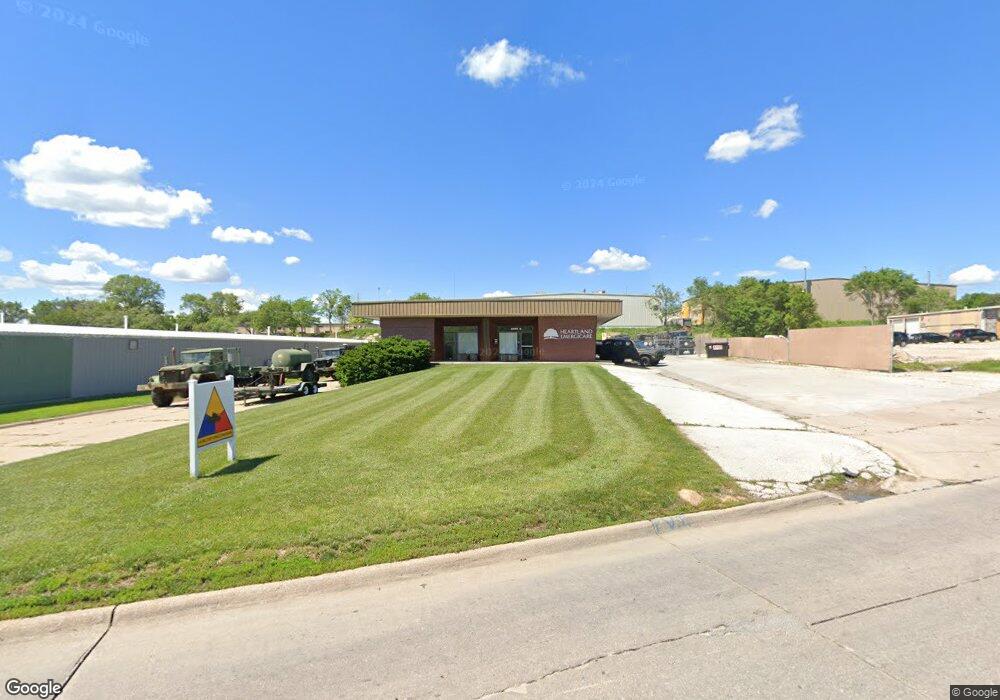
4670 G St Omaha, NE 68117
South Central Omaha NeighborhoodEstimated Value: $1,101,906
--
Bed
--
Bath
6,250
Sq Ft
$176/Sq Ft
Est. Value
About This Home
This home is located at 4670 G St, Omaha, NE 68117 and is currently estimated at $1,101,906, approximately $176 per square foot. 4670 G St is a home located in Douglas County with nearby schools including Ashland Park-Robbins Elementary School and St Thomas More School.
Ownership History
Date
Name
Owned For
Owner Type
Purchase Details
Closed on
May 13, 2015
Sold by
Jkb Properties Llc
Bought by
Barger Properties Llc
Current Estimated Value
Home Financials for this Owner
Home Financials are based on the most recent Mortgage that was taken out on this home.
Original Mortgage
$425,000
Outstanding Balance
$327,998
Interest Rate
3.73%
Mortgage Type
Future Advance Clause Open End Mortgage
Estimated Equity
$773,908
Purchase Details
Closed on
Nov 15, 2012
Sold by
Lucabella Properties Llc
Bought by
Jkb Properties Llc
Home Financials for this Owner
Home Financials are based on the most recent Mortgage that was taken out on this home.
Original Mortgage
$300,000
Interest Rate
3.37%
Mortgage Type
Future Advance Clause Open End Mortgage
Purchase Details
Closed on
Aug 26, 2010
Sold by
London Monica F and Forman John L
Bought by
Lucabella Properties Llc
Create a Home Valuation Report for This Property
The Home Valuation Report is an in-depth analysis detailing your home's value as well as a comparison with similar homes in the area
Home Values in the Area
Average Home Value in this Area
Purchase History
| Date | Buyer | Sale Price | Title Company |
|---|---|---|---|
| Barger Properties Llc | $530,000 | Missouri River Title | |
| Jkb Properties Llc | $230,769 | Nebraska Title Company | |
| Lucabella Properties Llc | -- | None Available |
Source: Public Records
Mortgage History
| Date | Status | Borrower | Loan Amount |
|---|---|---|---|
| Open | Barger Properties Llc | $425,000 | |
| Previous Owner | Jkb Properties Llc | $300,000 |
Source: Public Records
Tax History Compared to Growth
Tax History
| Year | Tax Paid | Tax Assessment Tax Assessment Total Assessment is a certain percentage of the fair market value that is determined by local assessors to be the total taxable value of land and additions on the property. | Land | Improvement |
|---|---|---|---|---|
| 2024 | $13,733 | $675,000 | $118,000 | $557,000 |
| 2023 | $13,733 | $650,900 | $118,000 | $532,900 |
| 2022 | $13,508 | $632,800 | $118,000 | $514,800 |
| 2021 | $11,480 | $542,400 | $118,000 | $424,400 |
| 2020 | $11,612 | $542,400 | $95,800 | $446,600 |
| 2019 | $9,783 | $455,600 | $95,800 | $359,800 |
| 2018 | $9,796 | $455,600 | $95,800 | $359,800 |
| 2017 | $8,887 | $411,300 | $95,800 | $315,500 |
| 2016 | $8,826 | $411,300 | $95,800 | $315,500 |
| 2015 | $8,038 | $379,700 | $95,800 | $283,900 |
| 2014 | $8,038 | $379,700 | $95,800 | $283,900 |
Source: Public Records
Map
Nearby Homes