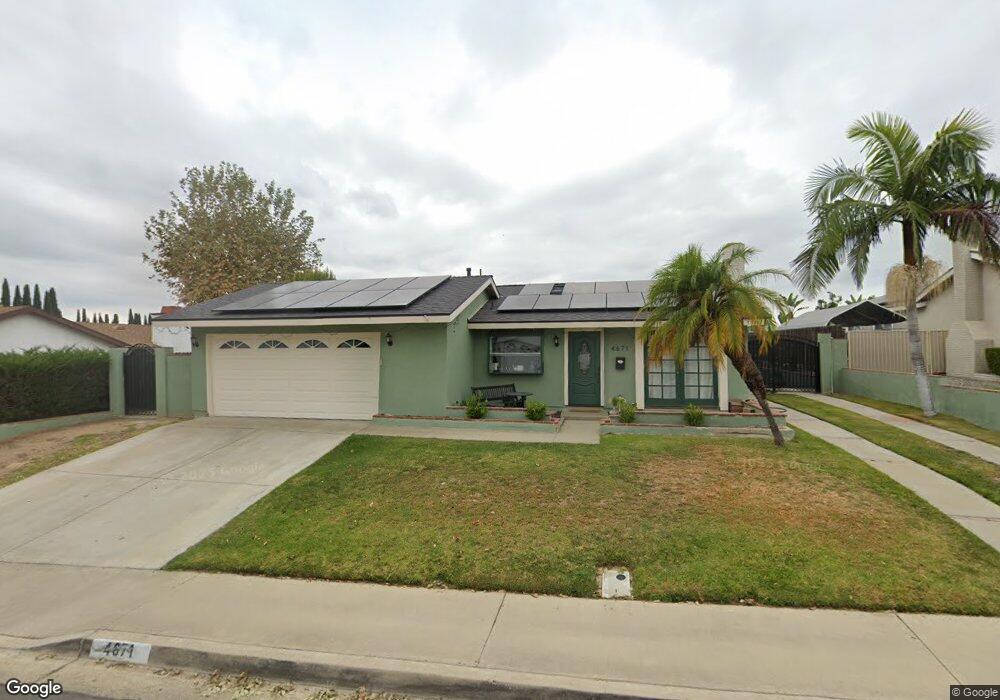
4671 Via Loma Linda Yorba Linda, CA 92886
Estimated Value: $1,025,958 - $1,196,000
4
Beds
2
Baths
1,470
Sq Ft
$760/Sq Ft
Est. Value
About This Home
This home is located at 4671 Via Loma Linda, Yorba Linda, CA 92886 and is currently estimated at $1,116,740, approximately $759 per square foot. 4671 Via Loma Linda is a home located in Orange County with nearby schools including Fairmont Elementary, Bernardo Yorba Middle School, and Yorba Linda High School.
Ownership History
Date
Name
Owned For
Owner Type
Purchase Details
Closed on
Dec 18, 2006
Sold by
Castillo Leonard J and Castillo Nicole R
Bought by
Castillo Leonard J and Castillo Nicole R
Current Estimated Value
Home Financials for this Owner
Home Financials are based on the most recent Mortgage that was taken out on this home.
Original Mortgage
$390,000
Outstanding Balance
$215,834
Interest Rate
5%
Mortgage Type
Purchase Money Mortgage
Estimated Equity
$900,906
Purchase Details
Closed on
Feb 28, 2006
Sold by
Castillo Leonard J and Castillo Nicole R
Bought by
Castillo Leonard J and Castillo Nicole R
Purchase Details
Closed on
Jan 27, 1997
Sold by
Stull James C and Stull Veronica C
Bought by
Castillo Leonard J and Castillo Nicole R
Home Financials for this Owner
Home Financials are based on the most recent Mortgage that was taken out on this home.
Original Mortgage
$159,334
Interest Rate
7.81%
Mortgage Type
FHA
Create a Home Valuation Report for This Property
The Home Valuation Report is an in-depth analysis detailing your home's value as well as a comparison with similar homes in the area
Home Values in the Area
Average Home Value in this Area
Purchase History
| Date | Buyer | Sale Price | Title Company |
|---|---|---|---|
| Castillo Leonard J | -- | Accommodation | |
| Castillo Leonard J | -- | First American Title Co | |
| Castillo Leonard J | -- | None Available | |
| Castillo Leonard J | -- | None Available | |
| Castillo Leonard J | $163,000 | Continental Lawyers Title Co |
Source: Public Records
Mortgage History
| Date | Status | Borrower | Loan Amount |
|---|---|---|---|
| Open | Castillo Leonard J | $390,000 | |
| Closed | Castillo Leonard J | $159,334 |
Source: Public Records
Tax History Compared to Growth
Tax History
| Year | Tax Paid | Tax Assessment Tax Assessment Total Assessment is a certain percentage of the fair market value that is determined by local assessors to be the total taxable value of land and additions on the property. | Land | Improvement |
|---|---|---|---|---|
| 2025 | $3,396 | $265,466 | $165,861 | $99,605 |
| 2024 | $3,396 | $260,261 | $162,609 | $97,652 |
| 2023 | $3,325 | $255,158 | $159,420 | $95,738 |
| 2022 | $3,278 | $250,155 | $156,294 | $93,861 |
| 2021 | $3,215 | $245,250 | $153,229 | $92,021 |
| 2020 | $3,106 | $242,736 | $151,658 | $91,078 |
| 2019 | $3,005 | $237,977 | $148,684 | $89,293 |
| 2018 | $2,966 | $233,311 | $145,768 | $87,543 |
| 2017 | $2,919 | $228,737 | $142,910 | $85,827 |
| 2016 | $2,863 | $224,252 | $140,107 | $84,145 |
| 2015 | $2,828 | $220,884 | $138,002 | $82,882 |
| 2014 | $2,747 | $216,558 | $135,299 | $81,259 |
Source: Public Records
Map
Nearby Homes
- 4545 Avenida Rio Del Oro
- 4418 Avenida Del Este
- 4362 Via Alegre
- 4446 Avenida de Las Flores
- 91 VAC/COR E Avenue L
- 21590 Via Pepita
- 19841 Lombardy Ln
- 20212 Chianti Ct
- 5289 Via Andalusia
- 19831 Caprice Dr
- 20100 Livorno Ln
- 20660 Calle Feliz
- 19862 Le Mans Cir
- 20681 Via Amarilla
- 4774 Serrente Plaza
- 20455 Via Cadiz
- 4090 Naples Ct
- 4741 Cardena Plaza
- 4152 Beech Ave
- 4066 Villa Quintana
- 4651 Via Loma Linda
- 4660 Via Frondosa
- 4680 Via Frondosa
- 4650 Via Frondosa
- 4691 Via Loma Linda
- 4641 Via Loma Linda
- 4670 Via Loma Linda
- 4660 Via Loma Linda
- 4640 Via Frondosa
- 4690 Via Frondosa
- 4680 Via Loma Linda
- 4640 Via Loma Linda
- 4690 Via Loma Linda
- 4630 Via Frondosa
- 4711 Via Loma Linda
- 4710 Via Frondosa
- 4661 Via Frondosa
- 4621 Via Loma Linda
- 4681 Via Frondosa
- 4661 Avenida Del Este