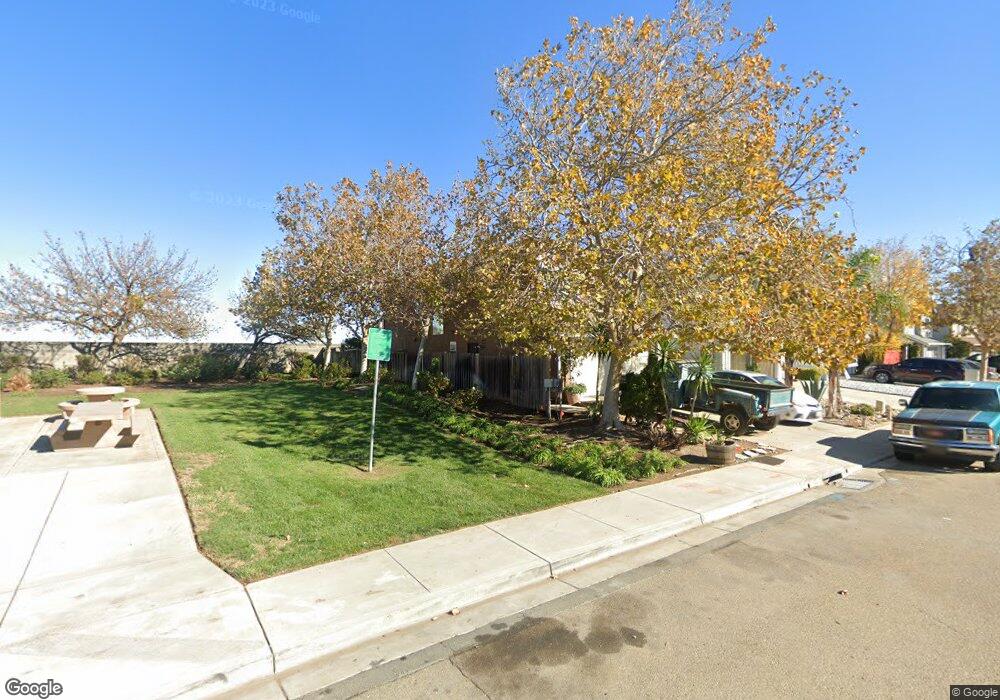
4672 Bayside Way Oakley, CA 94561
Estimated Value: $558,048 - $681,000
3
Beds
3
Baths
1,650
Sq Ft
$362/Sq Ft
Est. Value
About This Home
This home is located at 4672 Bayside Way, Oakley, CA 94561 and is currently estimated at $597,012, approximately $361 per square foot. 4672 Bayside Way is a home located in Contra Costa County with nearby schools including Gehringer Elementary School, O'Hara Park Middle School, and Freedom High School.
Ownership History
Date
Name
Owned For
Owner Type
Purchase Details
Closed on
Oct 22, 2015
Sold by
Padilla Ofelia
Bought by
Padilla Ofelia and Castro Juan R
Current Estimated Value
Home Financials for this Owner
Home Financials are based on the most recent Mortgage that was taken out on this home.
Original Mortgage
$200,000
Outstanding Balance
$157,305
Interest Rate
3.87%
Mortgage Type
New Conventional
Estimated Equity
$439,707
Purchase Details
Closed on
Nov 9, 2004
Sold by
Day Amy and Day Paul T
Bought by
Padilla Ofelia
Home Financials for this Owner
Home Financials are based on the most recent Mortgage that was taken out on this home.
Original Mortgage
$269,500
Interest Rate
5.79%
Mortgage Type
Stand Alone First
Purchase Details
Closed on
May 1, 2002
Sold by
Hatfield David A and Hatfield Victoria L
Bought by
Day Paul T and Day Amy
Home Financials for this Owner
Home Financials are based on the most recent Mortgage that was taken out on this home.
Original Mortgage
$211,932
Interest Rate
7.18%
Mortgage Type
FHA
Create a Home Valuation Report for This Property
The Home Valuation Report is an in-depth analysis detailing your home's value as well as a comparison with similar homes in the area
Home Values in the Area
Average Home Value in this Area
Purchase History
| Date | Buyer | Sale Price | Title Company |
|---|---|---|---|
| Padilla Ofelia | -- | First American Title Company | |
| Padilla Ofelia | $385,000 | Alliance Title Company | |
| Day Paul T | $261,000 | Old Republic Title Company |
Source: Public Records
Mortgage History
| Date | Status | Borrower | Loan Amount |
|---|---|---|---|
| Open | Padilla Ofelia | $200,000 | |
| Closed | Padilla Ofelia | $269,500 | |
| Previous Owner | Day Paul T | $211,932 | |
| Closed | Padilla Ofelia | $77,000 |
Source: Public Records
Tax History Compared to Growth
Tax History
| Year | Tax Paid | Tax Assessment Tax Assessment Total Assessment is a certain percentage of the fair market value that is determined by local assessors to be the total taxable value of land and additions on the property. | Land | Improvement |
|---|---|---|---|---|
| 2025 | $6,290 | $454,761 | $81,858 | $372,903 |
| 2024 | $6,214 | $445,845 | $80,253 | $365,592 |
| 2023 | $6,214 | $437,104 | $78,680 | $358,424 |
| 2022 | $6,157 | $428,535 | $77,138 | $351,397 |
| 2021 | $6,057 | $420,133 | $75,626 | $344,507 |
| 2019 | $5,776 | $407,674 | $73,384 | $334,290 |
| 2018 | $5,337 | $374,000 | $67,323 | $306,677 |
| 2017 | $4,904 | $333,000 | $59,943 | $273,057 |
| 2016 | $4,149 | $280,000 | $50,403 | $229,597 |
| 2015 | $4,326 | $297,000 | $57,855 | $239,145 |
| 2014 | $4,326 | $278,000 | $54,154 | $223,846 |
Source: Public Records
Map
Nearby Homes
- 4545 Waterford Way
- 210 W Cypress Rd Unit 27
- 210 W Cypress Rd Unit 1
- 354 Hazelnut Ln
- 78 Vella Cir
- 9999 7th St
- 4309 Beechnut Ln
- 4301 Beechnut Ln
- 236 Brazil Ct
- 1011 Warhol Way
- 145 Warhol Way
- 0 Almond Dr Unit 41106452
- 3901-B Rose Ave
- 4746 Mammouth Ln
- 214 E Ruby St
- 4901 Snowy Egret Way
- 876 Diamante Way
- 14 Renoir Ct
- 53 Puffin Cir
- 3906 Harvest Cir
- 4668 Bayside Way
- 4660 Bayside Way
- 4671 Bayside Way
- 4588 Waterford Way
- 4667 Bayside Way
- 4584 Waterford Way
- 4663 Bayside Way
- 4652 Bayside Way
- 4659 Bayside Way
- 4580 Waterford Way
- 4576 Waterford Way
- 4648 Bayside Way
- 4639 Bayside Way
- 4572 Waterford Way
- 4701 Bayside Way
- 4644 Bayside Way
- 4568 Waterford Way
- 310 Brookview Dr
- 4635 Bayside Way
- 4708 Bayside Way