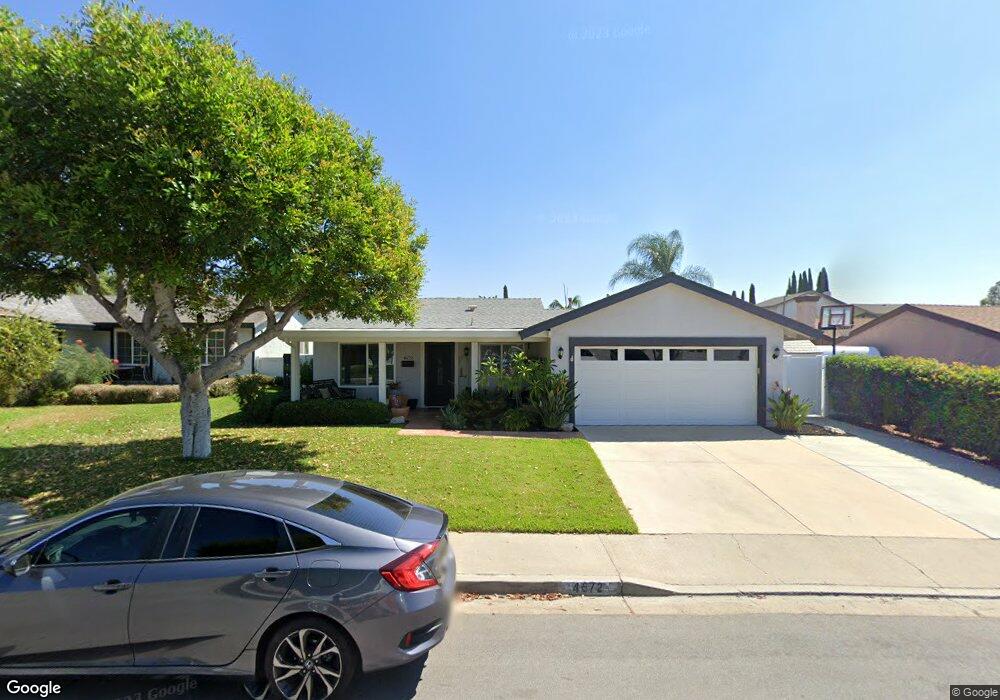
4672 Via de la Luna Yorba Linda, CA 92886
Estimated Value: $946,693 - $1,127,000
3
Beds
2
Baths
1,152
Sq Ft
$902/Sq Ft
Est. Value
About This Home
This home is located at 4672 Via de la Luna, Yorba Linda, CA 92886 and is currently estimated at $1,039,423, approximately $902 per square foot. 4672 Via de la Luna is a home located in Orange County with nearby schools including Fairmont Elementary, Bernardo Yorba Middle School, and Yorba Linda High School.
Ownership History
Date
Name
Owned For
Owner Type
Purchase Details
Closed on
Jul 28, 2010
Sold by
Via De La Luna Trust #4672
Bought by
Roberts Kyle M and Roberts Kristen F
Current Estimated Value
Home Financials for this Owner
Home Financials are based on the most recent Mortgage that was taken out on this home.
Original Mortgage
$433,962
Interest Rate
4.45%
Mortgage Type
FHA
Purchase Details
Closed on
Apr 21, 2010
Sold by
Ballard Dean A and Ballard Marcia L
Bought by
Via De La Luna Trust #4672 and T D Bancorp
Purchase Details
Closed on
Nov 10, 2000
Sold by
Wilson Valna Y
Bought by
Wilson Valna Y
Purchase Details
Closed on
Sep 1, 2000
Sold by
Wilson Valna Y
Bought by
Ballard Dean A and Ballard Marcia L
Home Financials for this Owner
Home Financials are based on the most recent Mortgage that was taken out on this home.
Original Mortgage
$226,100
Interest Rate
7.66%
Create a Home Valuation Report for This Property
The Home Valuation Report is an in-depth analysis detailing your home's value as well as a comparison with similar homes in the area
Home Values in the Area
Average Home Value in this Area
Purchase History
| Date | Buyer | Sale Price | Title Company |
|---|---|---|---|
| Roberts Kyle M | $440,000 | First American Title Company | |
| Via De La Luna Trust #4672 | $360,500 | None Available | |
| Wilson Valna Y | -- | -- | |
| Ballard Dean A | $238,000 | First American Title Co |
Source: Public Records
Mortgage History
| Date | Status | Borrower | Loan Amount |
|---|---|---|---|
| Previous Owner | Roberts Kyle M | $433,962 | |
| Previous Owner | Ballard Dean A | $226,100 |
Source: Public Records
Tax History Compared to Growth
Tax History
| Year | Tax Paid | Tax Assessment Tax Assessment Total Assessment is a certain percentage of the fair market value that is determined by local assessors to be the total taxable value of land and additions on the property. | Land | Improvement |
|---|---|---|---|---|
| 2025 | $6,513 | $572,921 | $482,940 | $89,981 |
| 2024 | $6,513 | $561,688 | $473,471 | $88,217 |
| 2023 | $6,392 | $550,675 | $464,187 | $86,488 |
| 2022 | $6,324 | $539,878 | $455,085 | $84,793 |
| 2021 | $6,209 | $529,293 | $446,162 | $83,131 |
| 2020 | $6,110 | $523,866 | $441,587 | $82,279 |
| 2019 | $5,896 | $513,595 | $432,929 | $80,666 |
| 2018 | $5,821 | $503,525 | $424,440 | $79,085 |
| 2017 | $5,726 | $493,652 | $416,117 | $77,535 |
| 2016 | $5,610 | $483,973 | $407,958 | $76,015 |
| 2015 | $5,541 | $476,704 | $401,830 | $74,874 |
| 2014 | $5,377 | $467,367 | $393,959 | $73,408 |
Source: Public Records
Map
Nearby Homes
- 4545 Avenida Rio Del Oro
- 4418 Avenida Del Este
- 4446 Avenida de Las Flores
- 91 VAC/COR E Avenue L
- 4362 Via Alegre
- 19841 Lombardy Ln
- 19831 Caprice Dr
- 20212 Chianti Ct
- 5289 Via Andalusia
- 20100 Livorno Ln
- 21590 Via Pepita
- 4774 Serrente Plaza
- 19862 Le Mans Cir
- 4741 Cardena Plaza
- 20660 Calle Feliz
- 20455 Via Cadiz
- 20681 Via Amarilla
- 4090 Naples Ct
- 4066 Villa Quintana
- 4154 Princeton Place
- 4662 Via de la Luna
- 4682 Via de la Luna
- 4691 Via Frondosa
- 4681 Via Frondosa
- 4652 Via de la Luna
- 4692 Via de la Luna
- 4711 Via Frondosa
- 4671 Via de la Luna
- 4661 Via Frondosa
- 4661 Via de la Luna
- 4681 Via de la Luna
- 4642 Via de la Luna
- 4712 Via de la Luna
- 4721 Via Frondosa
- 4651 Via de la Luna
- 4691 Via de la Luna
- 4651 Via Frondosa
- 4641 Via de la Luna
- 4711 Via de la Luna
- 4722 Via de la Luna