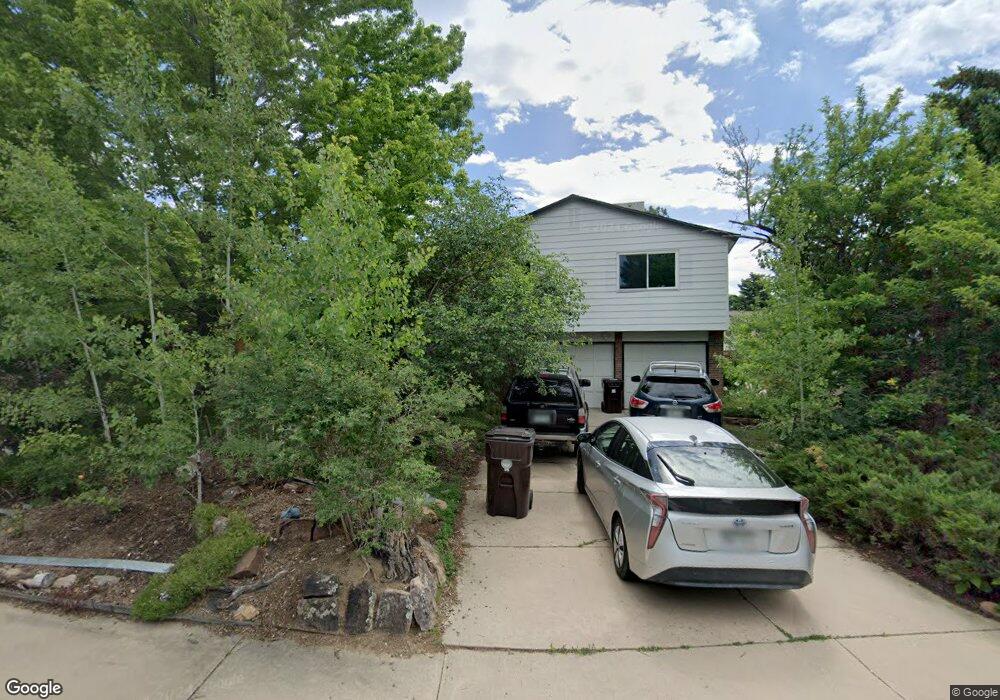
4676 Fordham Cir Boulder, CO 80301
Gunbarrel NeighborhoodEstimated Value: $734,000 - $772,000
3
Beds
3
Baths
1,805
Sq Ft
$414/Sq Ft
Est. Value
About This Home
This home is located at 4676 Fordham Cir, Boulder, CO 80301 and is currently estimated at $747,771, approximately $414 per square foot. 4676 Fordham Cir is a home located in Boulder County with nearby schools including Heatherwood Elementary School, Nevin Platt Middle School, and Boulder High School.
Ownership History
Date
Name
Owned For
Owner Type
Purchase Details
Closed on
May 20, 2009
Sold by
Benjamin Elizabeth L
Bought by
Benjamin Elizabeth L
Current Estimated Value
Home Financials for this Owner
Home Financials are based on the most recent Mortgage that was taken out on this home.
Original Mortgage
$240,500
Outstanding Balance
$149,898
Interest Rate
4.84%
Mortgage Type
New Conventional
Estimated Equity
$597,873
Purchase Details
Closed on
Dec 3, 2001
Sold by
Smaagaard Gail K
Bought by
Benjamin Elizabeth L
Home Financials for this Owner
Home Financials are based on the most recent Mortgage that was taken out on this home.
Original Mortgage
$210,000
Interest Rate
7%
Purchase Details
Closed on
Jun 15, 1993
Bought by
Cameron Gregory J
Purchase Details
Closed on
Apr 13, 1979
Bought by
Cameron Gregory J
Purchase Details
Closed on
Apr 11, 1975
Bought by
Cameron Gregory J
Create a Home Valuation Report for This Property
The Home Valuation Report is an in-depth analysis detailing your home's value as well as a comparison with similar homes in the area
Home Values in the Area
Average Home Value in this Area
Purchase History
| Date | Buyer | Sale Price | Title Company |
|---|---|---|---|
| Benjamin Elizabeth L | -- | None Available | |
| Benjamin Elizabeth L | $310,000 | -- | |
| Cameron Gregory J | $145,700 | -- | |
| Cameron Gregory J | $73,500 | -- | |
| Cameron Gregory J | $42,000 | -- |
Source: Public Records
Mortgage History
| Date | Status | Borrower | Loan Amount |
|---|---|---|---|
| Open | Benjamin Elizabeth L | $240,500 | |
| Closed | Benjamin Elizabeth L | $210,000 |
Source: Public Records
Tax History
| Year | Tax Paid | Tax Assessment Tax Assessment Total Assessment is a certain percentage of the fair market value that is determined by local assessors to be the total taxable value of land and additions on the property. | Land | Improvement |
|---|---|---|---|---|
| 2025 | $4,855 | $52,888 | $22,494 | $30,394 |
| 2024 | $4,855 | $52,888 | $22,494 | $30,394 |
| 2023 | $4,776 | $52,428 | $24,669 | $31,443 |
| 2022 | $4,080 | $41,735 | $18,133 | $23,602 |
| 2021 | $3,890 | $42,935 | $18,654 | $24,281 |
| 2020 | $3,627 | $39,575 | $16,731 | $22,844 |
| 2019 | $3,571 | $39,575 | $16,731 | $22,844 |
| 2018 | $3,204 | $35,086 | $13,896 | $21,190 |
| 2017 | $3,109 | $38,789 | $15,363 | $23,426 |
| 2016 | $2,756 | $30,169 | $12,975 | $17,194 |
| 2015 | $2,618 | $27,080 | $12,656 | $14,424 |
| 2014 | $2,647 | $27,080 | $12,656 | $14,424 |
Source: Public Records
Map
Nearby Homes
- 7750 Durham Way
- 4620 Kirkwood St
- 4667 Ashfield Dr
- 4423 Alberta Ct
- 4788 Briar Ridge Trail
- 4935 Sundance Square
- 7312 Island Cir
- 4803 Briar Ridge Ct
- 4936 Clubhouse Cir
- 4500 S Meadow Dr
- 5174 Buckingham Rd Unit L1
- 5020 Buckingham Rd Unit B2
- 7481 Singing Hills Dr
- 4422 Pali Way
- 4953 Clubhouse Ct
- 7447 Singing Hills Ct Unit 202
- 7434 Singing Hills Ct Unit J7434
- 7443 Singing Hills Ct Unit Q
- 7411 Spy Glass Ct Unit N7411
- 7205 Rustic Trail
- 4656 Fordham Cir
- 4696 Fordham Cir
- 7899 Devonshire Way
- 4685 Fordham Cir
- 4665 Fordham Cir
- 4675 Fordham Cir
- 4655 Fordham Cir
- 4695 Fordham Cir
- 7878 Devonshire Way
- 7868 Devonshire Way
- 4653 Greylock St
- 4663 Greylock St
- 7773 Essex Place
- 4724 Essex Ct
- 7898 Devonshire Way
- 7783 Essex Place
- 4734 Essex Ct
- 4714 Essex Ct
- 7870 Grasmere Dr
- 7793 Essex Place
Your Personal Tour Guide
Ask me questions while you tour the home.