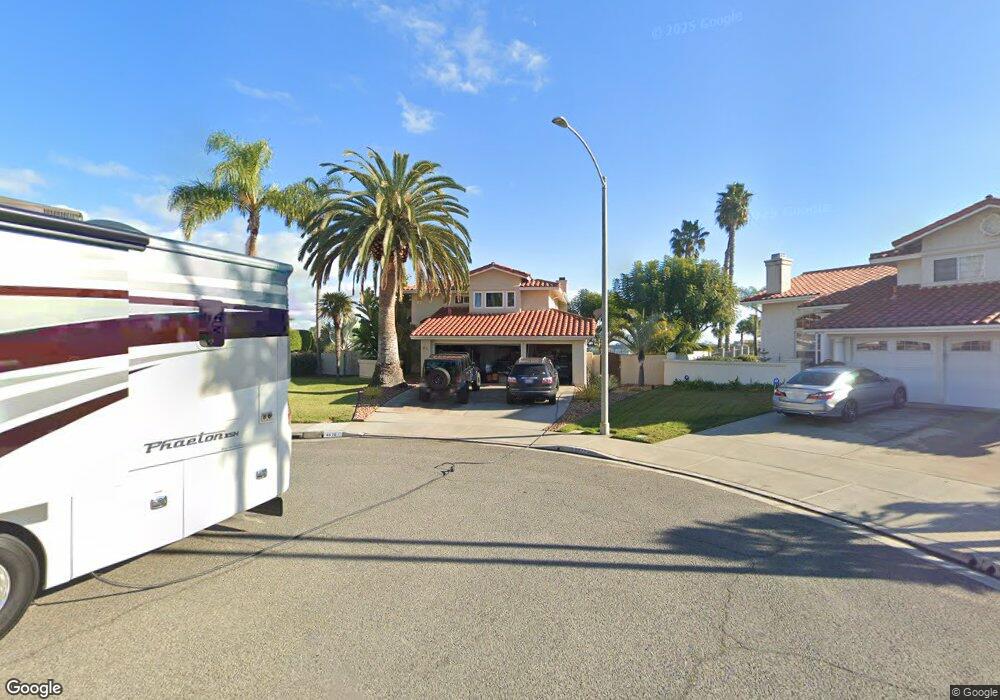
4676 Pannonia Rd Carlsbad, CA 92008
Hedionda Point NeighborhoodEstimated Value: $1,951,000 - $1,974,000
3
Beds
3
Baths
2,383
Sq Ft
$825/Sq Ft
Est. Value
About This Home
This home is located at 4676 Pannonia Rd, Carlsbad, CA 92008 and is currently estimated at $1,964,826, approximately $824 per square foot. 4676 Pannonia Rd is a home located in San Diego County with nearby schools including Kelly Elementary School, Carlsbad High School, and Sage Creek High.
Ownership History
Date
Name
Owned For
Owner Type
Purchase Details
Closed on
Dec 21, 2008
Sold by
Griffin Robert A and Griffin Christine J
Bought by
Griffin Robert A and Griffin Christine J
Current Estimated Value
Purchase Details
Closed on
Sep 15, 1995
Sold by
Charles Keith C and Charles Misha T
Bought by
Griffin Robert A and Griffin Christine J
Home Financials for this Owner
Home Financials are based on the most recent Mortgage that was taken out on this home.
Original Mortgage
$292,600
Interest Rate
7.37%
Purchase Details
Closed on
Oct 6, 1994
Sold by
Abrams Robert M
Bought by
Charles Keith C and Charles Misha T
Home Financials for this Owner
Home Financials are based on the most recent Mortgage that was taken out on this home.
Original Mortgage
$320,400
Interest Rate
8.9%
Purchase Details
Closed on
Sep 25, 1992
Purchase Details
Closed on
Oct 12, 1988
Create a Home Valuation Report for This Property
The Home Valuation Report is an in-depth analysis detailing your home's value as well as a comparison with similar homes in the area
Home Values in the Area
Average Home Value in this Area
Purchase History
| Date | Buyer | Sale Price | Title Company |
|---|---|---|---|
| Griffin Robert A | -- | None Available | |
| Griffin Robert A | -- | None Available | |
| Griffin Robert A | $366,000 | Guardian Title Company | |
| Charles Keith C | $356,000 | Guardian Title Company | |
| -- | $362,700 | -- | |
| -- | $347,500 | -- |
Source: Public Records
Mortgage History
| Date | Status | Borrower | Loan Amount |
|---|---|---|---|
| Closed | Griffin Robert A | $292,600 | |
| Previous Owner | Charles Keith C | $320,400 |
Source: Public Records
Tax History Compared to Growth
Tax History
| Year | Tax Paid | Tax Assessment Tax Assessment Total Assessment is a certain percentage of the fair market value that is determined by local assessors to be the total taxable value of land and additions on the property. | Land | Improvement |
|---|---|---|---|---|
| 2025 | $6,323 | $607,578 | $299,385 | $308,193 |
| 2024 | $6,323 | $595,665 | $293,515 | $302,150 |
| 2023 | $6,289 | $583,986 | $287,760 | $296,226 |
| 2022 | $6,190 | $572,536 | $282,118 | $290,418 |
| 2021 | $6,143 | $561,311 | $276,587 | $284,724 |
| 2020 | $6,101 | $555,556 | $273,751 | $281,805 |
| 2019 | $5,990 | $544,664 | $268,384 | $276,280 |
| 2018 | $5,736 | $533,985 | $263,122 | $270,863 |
| 2017 | $5,639 | $523,515 | $257,963 | $265,552 |
| 2016 | $5,412 | $513,251 | $252,905 | $260,346 |
| 2015 | $5,389 | $505,543 | $249,107 | $256,436 |
| 2014 | $5,298 | $495,641 | $244,228 | $251,413 |
Source: Public Records
Map
Nearby Homes
- 4781 Argosy Ln
- 1741 Bruce Rd
- 4640 Sunburst Rd
- 4705 Marina Dr Unit 10
- 4735 Bryce Cir
- 4814 Refugio Ave
- 4843 Flying Cloud Way
- 4747 Marina Dr Unit 23
- 4623 Telescope Ave
- 4143 Sunnyhill Dr
- 0 Adams St Unit OC24201399
- 4874 Park Dr
- 4876 Park Dr
- 0 Sunny Creek Unit PI25230627
- 0 Hoover St
- 1095 Hoover St
- 1816 E Pointe Ave
- 0 Park Dr
- 4000 James Dr
- 1120 Cape Aire Ln
- 4677 Pannonia Rd
- 4670 Pannonia Rd
- 4376 Horizon Dr
- 4356 Horizon Dr
- 4671 Pannonia Rd
- 4666 Pannonia Rd
- 4416 Horizon Dr
- 4550 Sea Bluff Cir
- 4336 Horizon Dr
- 4667 Pannonia Rd
- 4316 Horizon Dr
- 4660 Pannonia Rd
- 4701 Sunburst Rd
- 4661 Pannonia Rd
- 4560 Sea Bluff Cir
- 4545 Coastline Ave
- 4310 Horizon Dr Unit 2
- 4656 Pannonia Rd
- 4535 Coastline Ave
- 4446 Horizon Dr