Estimated Value: $785,611 - $1,167,000
2
Beds
2
Baths
1,548
Sq Ft
$600/Sq Ft
Est. Value
About This Home
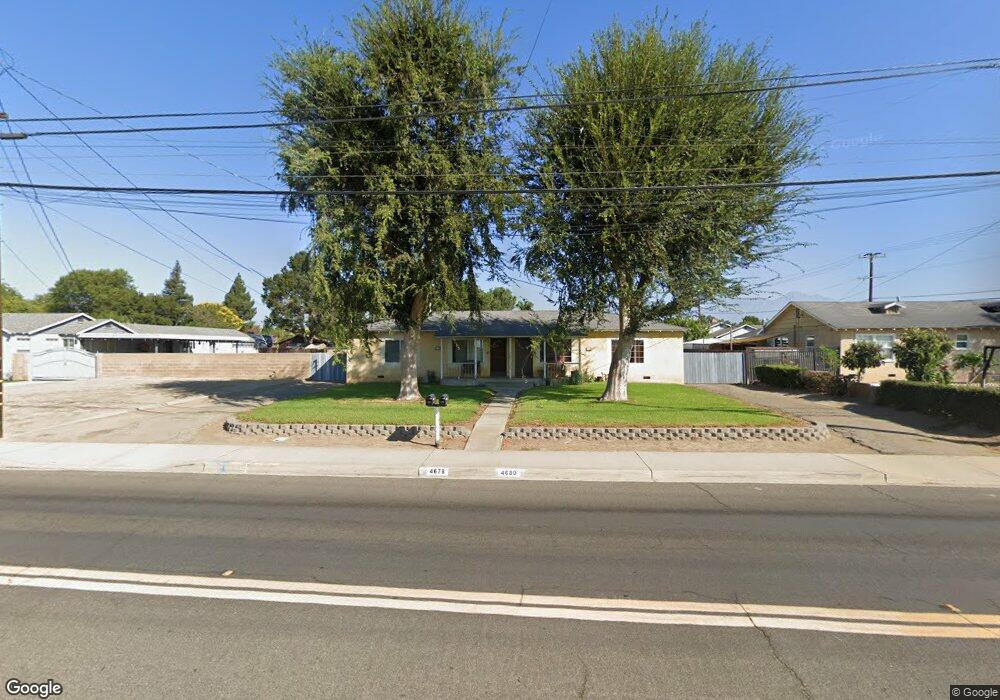
This home is located at 4678 Walnut Ave, Chino, CA 91710 and is currently estimated at $929,153, approximately $600 per square foot. 4678 Walnut Ave is a home located in San Bernardino County with nearby schools including Newman Elementary, Ramona Junior High School, and Don Antonio Lugo High School.
Ownership History
Date
Name
Owned For
Owner Type
Purchase Details
Closed on
Jun 16, 2005
Sold by
Murillo Luis
Bought by
Murillo Artemio and Murillo Jose J
Current Estimated Value
Home Financials for this Owner
Home Financials are based on the most recent Mortgage that was taken out on this home.
Original Mortgage
$265,000
Outstanding Balance
$137,365
Interest Rate
5.65%
Mortgage Type
Fannie Mae Freddie Mac
Estimated Equity
$791,788
Purchase Details
Closed on
Mar 13, 2001
Sold by
Murillo Maria Isabel
Bought by
Murillo Luis
Home Financials for this Owner
Home Financials are based on the most recent Mortgage that was taken out on this home.
Original Mortgage
$191,987
Interest Rate
6.98%
Purchase Details
Closed on
Feb 27, 2001
Sold by
Sparks Jeannie Cecilia
Bought by
Murillo Artemio and Murillo Luis
Home Financials for this Owner
Home Financials are based on the most recent Mortgage that was taken out on this home.
Original Mortgage
$191,987
Interest Rate
6.98%
Create a Home Valuation Report for This Property
The Home Valuation Report is an in-depth analysis detailing your home's value as well as a comparison with similar homes in the area
Home Values in the Area
Average Home Value in this Area
Purchase History
| Date | Buyer | Sale Price | Title Company |
|---|---|---|---|
| Murillo Artemio | -- | American-San Diego | |
| Murillo Luis | -- | Fidelity National Title | |
| Murillo Artemio | -- | Fidelity National Title | |
| Murillo Artemio | $220,000 | Fidelity National Title Ins |
Source: Public Records
Mortgage History
| Date | Status | Borrower | Loan Amount |
|---|---|---|---|
| Open | Murillo Artemio | $265,000 | |
| Previous Owner | Murillo Artemio | $191,987 |
Source: Public Records
Tax History Compared to Growth
Tax History
| Year | Tax Paid | Tax Assessment Tax Assessment Total Assessment is a certain percentage of the fair market value that is determined by local assessors to be the total taxable value of land and additions on the property. | Land | Improvement |
|---|---|---|---|---|
| 2025 | $4,500 | $412,045 | $120,364 | $291,681 |
| 2024 | $4,500 | $403,966 | $118,004 | $285,962 |
| 2023 | $4,376 | $396,045 | $115,690 | $280,355 |
| 2022 | $4,351 | $388,280 | $113,422 | $274,858 |
| 2021 | $4,266 | $380,667 | $111,198 | $269,469 |
| 2020 | $4,211 | $376,764 | $110,058 | $266,706 |
| 2019 | $4,138 | $369,376 | $107,900 | $261,476 |
| 2018 | $4,047 | $362,133 | $105,784 | $256,349 |
| 2017 | $3,975 | $355,033 | $103,710 | $251,323 |
| 2016 | $3,716 | $348,071 | $101,676 | $246,395 |
| 2015 | $3,642 | $342,843 | $100,149 | $242,694 |
| 2014 | $3,570 | $336,127 | $98,187 | $237,940 |
Source: Public Records
Map
Nearby Homes
- 12540 Ramona Ave
- 12138 Serra Ave
- 12139 Serra Ave
- 12152 Crystal Ave
- 4862 Lincoln Ave
- 4887 Philadelphia St
- 12686 3rd St
- 12132 Concord Ct
- 4400 Philadelphia St Unit 197
- 4400 Philadelphia St Unit 209
- 4400 Philadelphia St Unit 193
- 12150 Orgren Ave
- 4965 Independence St
- 12635 Franklin Ct Unit 8b
- 4099 Walnut Ave
- 12958 Boston Ave
- 11818 Yorba Ave
- 12940 4th St
- 5061 Chesapeake St
- 4025 Olive St
- 4690 Walnut Ave
- 4658 Walnut Ave
- 12462 Yorba Ave
- 4671 Walnut Ave
- 4677 Walnut Ave
- 12444 Yorba Ave
- 4685 Walnut Ave
- 12479 Yorba Ave
- 4712 Walnut Ave
- 4661 Walnut Ave
- 4632 Walnut Ave
- 12457 Yorba Ave
- 12437 Yorba Ave
- 4641 Walnut Ave
- 12507 Yorba Ave
- 4649 Walnut Ave
- 12432 Yorba Ave
- 12536 Yorba Ave
- 12511 Yorba Ave
- 12429 Yorba Ave