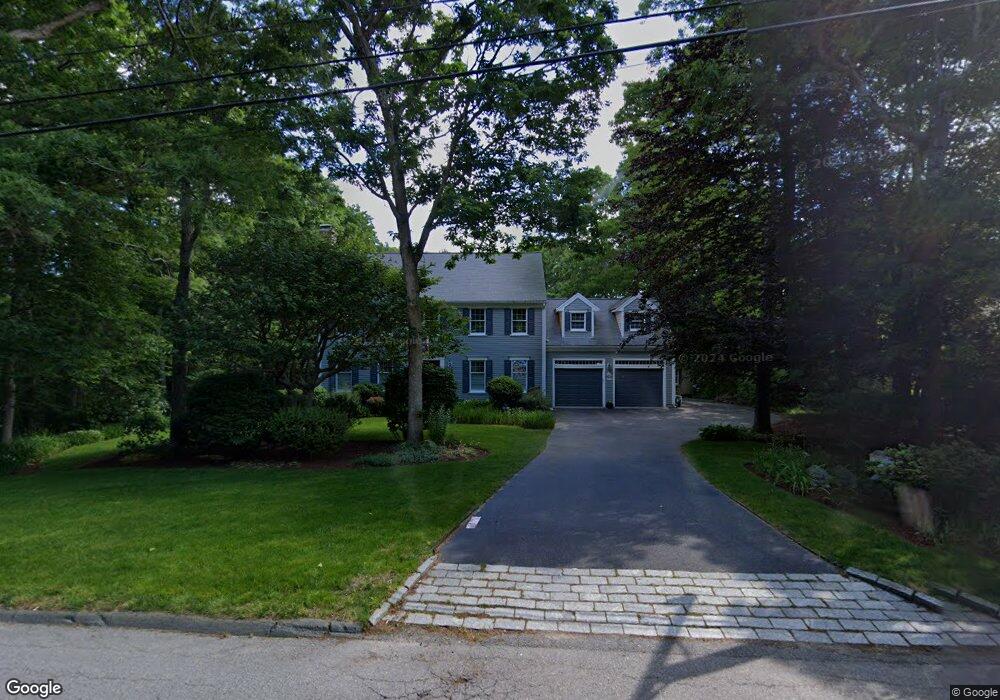
468 Cedar St West Barnstable, MA 02668
West Barnstable NeighborhoodEstimated Value: $821,000 - $1,243,000
3
Beds
3
Baths
2,701
Sq Ft
$359/Sq Ft
Est. Value
About This Home
This home is located at 468 Cedar St, West Barnstable, MA 02668 and is currently estimated at $968,974, approximately $358 per square foot. 468 Cedar St is a home located in Barnstable County with nearby schools including West Barnstable Elementary School, Barnstable United Elementary School, and Barnstable Intermediate School.
Ownership History
Date
Name
Owned For
Owner Type
Purchase Details
Closed on
Mar 29, 2016
Sold by
Lamson Judith A and Stemler Robert D
Bought by
468 Cedar Street T
Current Estimated Value
Purchase Details
Closed on
Jul 6, 2000
Sold by
Bourque John D and Bourque Debbie M
Bought by
Stemler Robert D
Purchase Details
Closed on
Apr 19, 1994
Sold by
Gould Joyce Lewis and Lewis Elwood J
Bought by
Bourque John D
Create a Home Valuation Report for This Property
The Home Valuation Report is an in-depth analysis detailing your home's value as well as a comparison with similar homes in the area
Home Values in the Area
Average Home Value in this Area
Purchase History
| Date | Buyer | Sale Price | Title Company |
|---|---|---|---|
| 468 Cedar Street T | -- | -- | |
| Stemler Robert D | $347,500 | -- | |
| Bourque John D | $39,900 | -- |
Source: Public Records
Mortgage History
| Date | Status | Borrower | Loan Amount |
|---|---|---|---|
| Previous Owner | Bourque John D | $133,500 | |
| Previous Owner | Bourque John D | $215,000 | |
| Previous Owner | Bourque John D | $220,000 |
Source: Public Records
Tax History
| Year | Tax Paid | Tax Assessment Tax Assessment Total Assessment is a certain percentage of the fair market value that is determined by local assessors to be the total taxable value of land and additions on the property. | Land | Improvement |
|---|---|---|---|---|
| 2025 | $7,558 | $809,200 | $200,500 | $608,700 |
| 2024 | $6,650 | $775,000 | $200,500 | $574,500 |
| 2023 | $6,291 | $690,600 | $198,200 | $492,400 |
| 2022 | $6,069 | $546,300 | $140,900 | $405,400 |
| 2021 | $6,024 | $514,000 | $140,900 | $373,100 |
| 2020 | $5,506 | $454,300 | $140,900 | $313,400 |
| 2019 | $5,630 | $458,500 | $140,900 | $317,600 |
| 2018 | $5,315 | $429,000 | $154,500 | $274,500 |
| 2017 | $5,157 | $421,300 | $154,500 | $266,800 |
| 2016 | $5,027 | $419,300 | $152,500 | $266,800 |
| 2015 | $4,973 | $415,800 | $153,100 | $262,700 |
Source: Public Records
Map
Nearby Homes
- 510 Cedar St
- 6 Harpers Hollow
- 46 Service Rd
- 7 Maxwell Ln
- 159 Great Hill Rd
- 3 Mulberry Cir
- 282 Parker Rd
- 817 Race Ln
- 817 Race Ln
- 29 Fish House Rd
- 74 Saddler Ln
- 4 Wing Blvd
- 566 Route 6a
- 29 Appaloosa Way
- 80 Branch Terrace
- 6 George Gallant Rd
- 0 Captain Kidd Rd
- 1028 Old Falmouth Rd
- 82 Old Fields Rd
- 507 Route 6a Unit 9
Your Personal Tour Guide
Ask me questions while you tour the home.