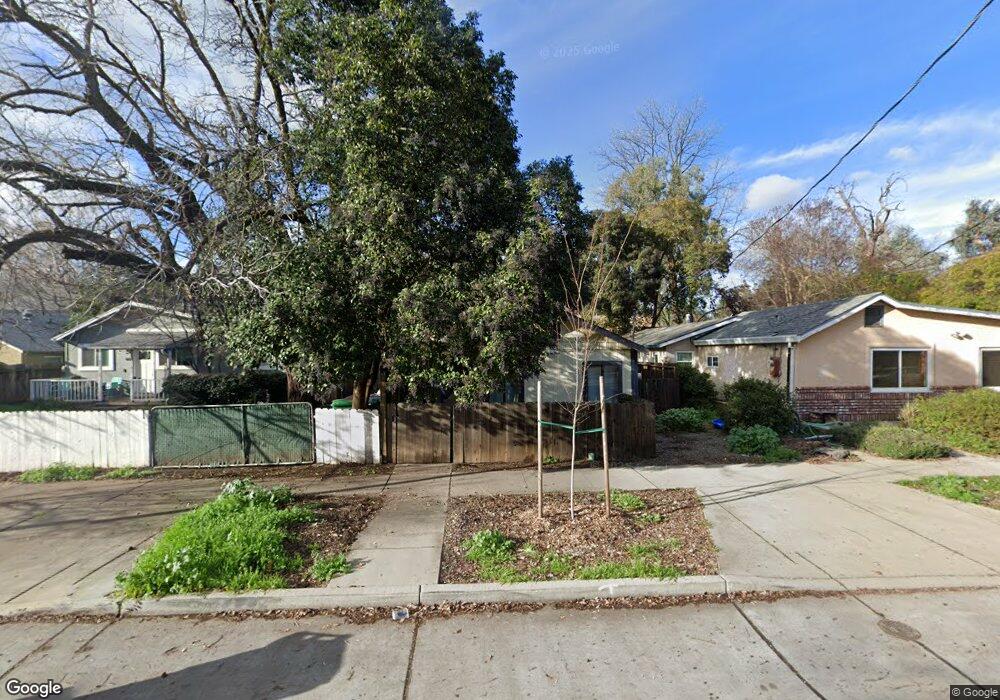
468 E 5th Ave Chico, CA 95926
Chico Vecino NeighborhoodEstimated Value: $223,000 - $257,436
2
Beds
1
Bath
674
Sq Ft
$354/Sq Ft
Est. Value
About This Home
This home is located at 468 E 5th Ave, Chico, CA 95926 and is currently estimated at $238,859, approximately $354 per square foot. 468 E 5th Ave is a home located in Butte County with nearby schools including Citrus Avenue Elementary School, Chico Junior High School, and Chico High School.
Ownership History
Date
Name
Owned For
Owner Type
Purchase Details
Closed on
Nov 3, 2004
Sold by
Devers Joseph R and Devers Katherine L
Bought by
Mazari Angelica
Current Estimated Value
Home Financials for this Owner
Home Financials are based on the most recent Mortgage that was taken out on this home.
Original Mortgage
$83,200
Outstanding Balance
$42,813
Interest Rate
6.25%
Mortgage Type
Stand Alone First
Estimated Equity
$196,046
Purchase Details
Closed on
Mar 6, 2000
Sold by
Sierra Industries Lp
Bought by
Devers Joseph R and Devers Katherine L
Home Financials for this Owner
Home Financials are based on the most recent Mortgage that was taken out on this home.
Original Mortgage
$56,250
Interest Rate
11.5%
Purchase Details
Closed on
Aug 5, 1999
Sold by
Faulkner Anthony W
Bought by
Sierra Industries Lp
Purchase Details
Closed on
May 28, 1999
Sold by
Nelson Faulkner Susan
Bought by
Faulkner Anthony W
Create a Home Valuation Report for This Property
The Home Valuation Report is an in-depth analysis detailing your home's value as well as a comparison with similar homes in the area
Home Values in the Area
Average Home Value in this Area
Purchase History
| Date | Buyer | Sale Price | Title Company |
|---|---|---|---|
| Mazari Angelica | $104,000 | -- | |
| Devers Joseph R | $62,500 | Bidwell Title & Escrow Compa | |
| Sierra Industries Lp | $45,000 | Bidwell Title & Escrow Co | |
| Faulkner Anthony W | -- | Bidwell Title & Escrow Co |
Source: Public Records
Mortgage History
| Date | Status | Borrower | Loan Amount |
|---|---|---|---|
| Open | Mazari Angelica | $83,200 | |
| Previous Owner | Devers Joseph R | $56,250 | |
| Closed | Devers Joseph R | $3,125 | |
| Closed | Mazari Angelica | $20,800 |
Source: Public Records
Tax History
| Year | Tax Paid | Tax Assessment Tax Assessment Total Assessment is a certain percentage of the fair market value that is determined by local assessors to be the total taxable value of land and additions on the property. | Land | Improvement |
|---|---|---|---|---|
| 2025 | $1,503 | $144,945 | $69,684 | $75,261 |
| 2024 | $1,503 | $142,104 | $68,318 | $73,786 |
| 2023 | $1,484 | $139,319 | $66,979 | $72,340 |
| 2022 | $1,458 | $136,588 | $65,666 | $70,922 |
| 2021 | $1,429 | $133,911 | $64,379 | $69,532 |
| 2020 | $1,424 | $132,539 | $63,719 | $68,820 |
| 2019 | $1,397 | $129,941 | $62,470 | $67,471 |
| 2018 | $1,370 | $127,395 | $61,246 | $66,149 |
| 2017 | $1,340 | $124,898 | $60,046 | $64,852 |
| 2016 | $1,222 | $122,450 | $58,869 | $63,581 |
| 2015 | $1,221 | $120,611 | $57,985 | $62,626 |
| 2014 | $1,203 | $118,250 | $56,850 | $61,400 |
Source: Public Records
Map
Nearby Homes
- 469 E 7th Ave
- 467 E 8th Ave
- 496 E 3rd Ave
- 1202 Palm Ave
- 460 E 10th Ave
- 1362 Magnolia Ave
- 256 E 1st Ave
- 363 E 1st Ave
- 168 E 1st Ave
- 1415 Sheridan Ave
- 1050 Esplanade
- 1617 Arcadian Ave
- 1125 Sheridan Ave Unit 37
- 1125 Sheridan Ave
- 1125 Sheridan Ave Unit 36
- 996 E 1st Ave
- 1421 Citrus Ave
- 1612 Neal Dow Ave
- 827 Arbutus Ave
- 1094 Manzanita Ave
- 470 E 5th Ave
- 466 E 5th Ave
- 472 E 5th Ave
- 482 E 5th Ave Unit 12
- 482 E 5th Ave
- 1500 Spruce Ave
- 1518 Spruce Ave
- 1524 Spruce Ave
- 496 E 5th Ave
- 1534 Spruce Ave
- 486 E 5th Ave
- 481 E 5th Ave
- 467 E 6th Ave
- 1536 Spruce Ave
- 475 E 5th Ave
- 498 E 5th Ave
- 1440 Spruce Ave Unit A
- 1461 Palm Ave
- 1540 Spruce Ave
- 1535 Palm Ave
Your Personal Tour Guide
Ask me questions while you tour the home.