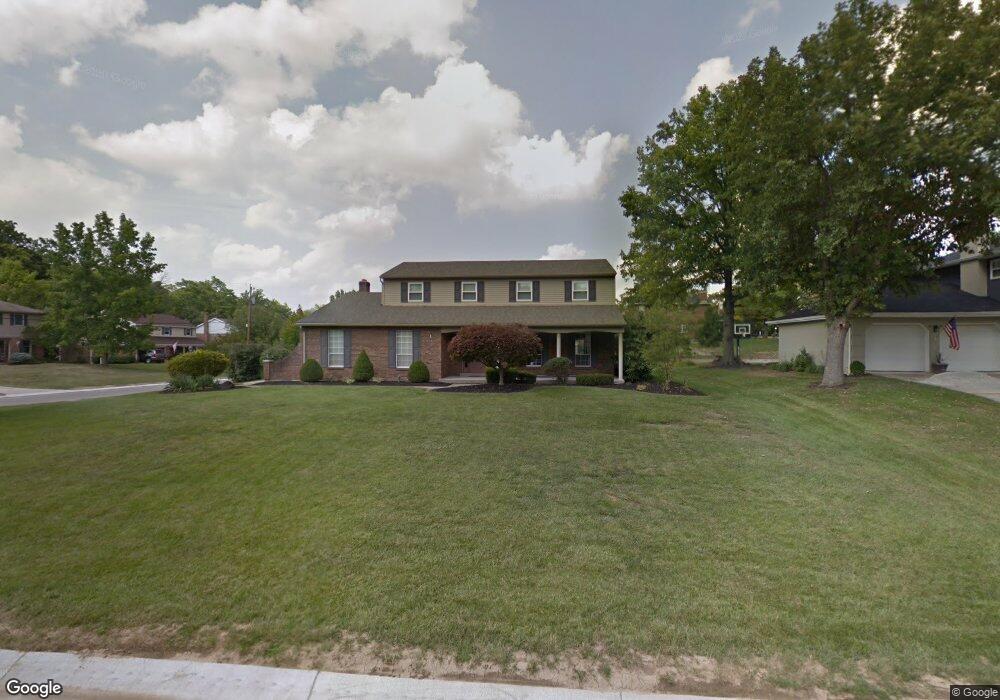
4680 Fardale Dr Cincinnati, OH 45247
White Oak West NeighborhoodEstimated Value: $377,000 - $446,000
4
Beds
3
Baths
2,146
Sq Ft
$188/Sq Ft
Est. Value
About This Home
This home is located at 4680 Fardale Dr, Cincinnati, OH 45247 and is currently estimated at $404,376, approximately $188 per square foot. 4680 Fardale Dr is a home located in Hamilton County with nearby schools including Monfort Heights Elementary School, White Oak Middle School, and Colerain High School.
Ownership History
Date
Name
Owned For
Owner Type
Purchase Details
Closed on
Nov 11, 2002
Sold by
Frey Linda A
Bought by
Frey Anthony L
Current Estimated Value
Home Financials for this Owner
Home Financials are based on the most recent Mortgage that was taken out on this home.
Original Mortgage
$191,250
Interest Rate
6.38%
Mortgage Type
Balloon
Purchase Details
Closed on
Dec 28, 1995
Sold by
Gerhardstein Keith H and Gerhardstein Tara J
Bought by
Frey Anthony L and Frey Linda A
Home Financials for this Owner
Home Financials are based on the most recent Mortgage that was taken out on this home.
Original Mortgage
$128,000
Interest Rate
7.36%
Create a Home Valuation Report for This Property
The Home Valuation Report is an in-depth analysis detailing your home's value as well as a comparison with similar homes in the area
Home Values in the Area
Average Home Value in this Area
Purchase History
| Date | Buyer | Sale Price | Title Company |
|---|---|---|---|
| Frey Anthony L | -- | -- | |
| Frey Anthony L | -- | -- |
Source: Public Records
Mortgage History
| Date | Status | Borrower | Loan Amount |
|---|---|---|---|
| Closed | Frey Anthony L | $191,250 | |
| Closed | Frey Anthony L | $128,000 |
Source: Public Records
Tax History Compared to Growth
Tax History
| Year | Tax Paid | Tax Assessment Tax Assessment Total Assessment is a certain percentage of the fair market value that is determined by local assessors to be the total taxable value of land and additions on the property. | Land | Improvement |
|---|---|---|---|---|
| 2024 | $5,838 | $110,159 | $14,336 | $95,823 |
| 2023 | $5,866 | $110,159 | $14,336 | $95,823 |
| 2022 | $5,138 | $78,786 | $13,920 | $64,866 |
| 2021 | $4,710 | $78,786 | $13,920 | $64,866 |
| 2020 | $4,756 | $78,786 | $13,920 | $64,866 |
| 2019 | $4,687 | $70,344 | $12,429 | $57,915 |
| 2018 | $4,174 | $70,344 | $12,429 | $57,915 |
| 2017 | $3,945 | $70,344 | $12,429 | $57,915 |
| 2016 | $3,809 | $66,907 | $12,303 | $54,604 |
| 2015 | $3,844 | $66,907 | $12,303 | $54,604 |
| 2014 | $3,851 | $66,907 | $12,303 | $54,604 |
| 2013 | $3,639 | $67,586 | $12,429 | $55,157 |
Source: Public Records
Map
Nearby Homes
- 4593 Farview Ln
- 4600 Farcrest Ct
- 4491 W Fork Rd
- 4044 W Fork Rd
- 4252 Runningfawn Dr
- 5160 Jessup Rd
- 5340 Meadow Walk Ln
- 5440 Asbury Lake Dr
- 5320 Meadow Walk Ln
- 5759 Cheviot Rd
- 5563 Haft Rd
- 5171 N Bend Crossing
- 5765 Cheviot Rd Unit 52D
- 5765 Cheviot Rd
- 5165 N Bend Crossing
- 5538 Silverpoint Dr
- 3547 Jessup Rd
- 6364 Oakcreek Dr
- 5737 Kroegermount Dr
- 4628 Boomer Rd
- 4662 Fardale Dr
- 4697 Farcrest Ct
- 4681 Farcrest Ct
- 5725 Farhaven Dr
- 5713 Farhaven Dr
- 4646 Fardale Dr
- 4671 Fardale Dr
- 4685 Fardale Dr
- 5737 Farhaven Dr
- 4675 Farcrest Ct
- 4657 Fardale Dr
- 4699 Fardale Dr
- 5749 Farhaven Dr
- 4643 Fardale Dr
- 4626 Fardale Dr
- 4659 Farcrest Ct
- 5761 Farhaven Dr
- 4629 Fardale Dr
- 4696 Farcrest Ct
- 4678 Farcrest Ct