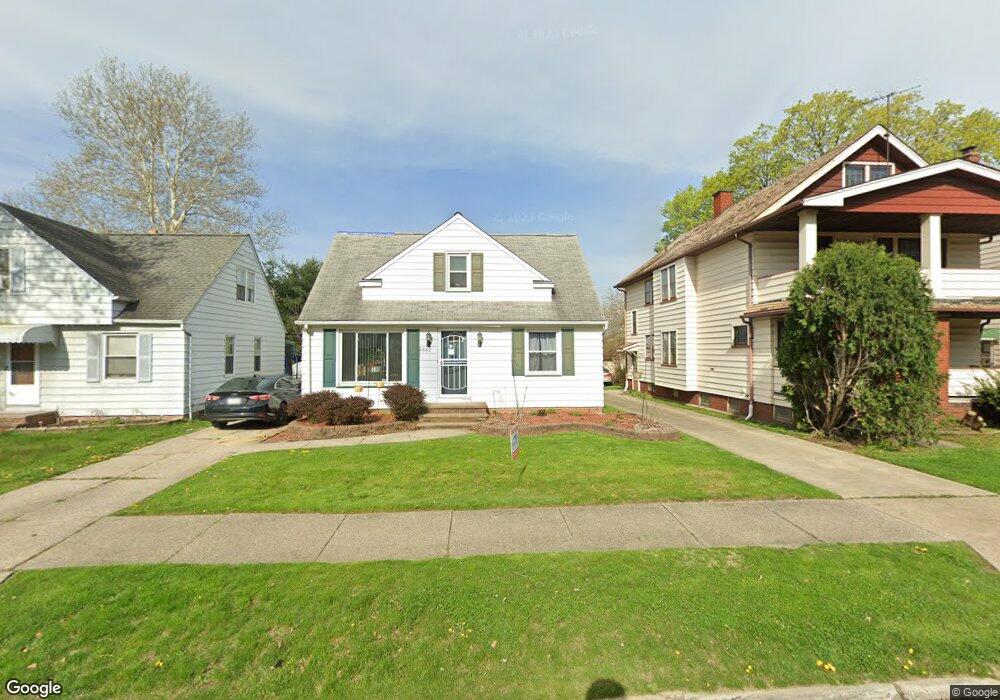
4682 E 93rd St Cleveland, OH 44125
Estimated Value: $99,974 - $135,000
3
Beds
2
Baths
1,131
Sq Ft
$103/Sq Ft
Est. Value
About This Home
This home is located at 4682 E 93rd St, Cleveland, OH 44125 and is currently estimated at $116,244, approximately $102 per square foot. 4682 E 93rd St is a home located in Cuyahoga County with nearby schools including Garfield Heights High School, North Shore High School, and Holy Name Elementary School.
Ownership History
Date
Name
Owned For
Owner Type
Purchase Details
Closed on
Oct 1, 2010
Sold by
Gervase Michael J and Gervase Michelle L
Bought by
Smith Linda M
Current Estimated Value
Home Financials for this Owner
Home Financials are based on the most recent Mortgage that was taken out on this home.
Original Mortgage
$68,083
Outstanding Balance
$44,698
Interest Rate
4.25%
Mortgage Type
FHA
Estimated Equity
$71,546
Purchase Details
Closed on
Jul 25, 1995
Sold by
Desciscio Marco C
Bought by
Gervse Michael J and Gervse Michele L
Home Financials for this Owner
Home Financials are based on the most recent Mortgage that was taken out on this home.
Original Mortgage
$65,200
Interest Rate
7.5%
Mortgage Type
New Conventional
Purchase Details
Closed on
Jun 7, 1988
Sold by
Lange Linda M
Bought by
Desciscio Marco C
Purchase Details
Closed on
Jan 14, 1986
Sold by
Cymanski Henry A and Cymanski Bertha
Bought by
Lange Linda M
Purchase Details
Closed on
Jan 1, 1975
Bought by
Cymanski Henry A and Cymanski Bertha
Create a Home Valuation Report for This Property
The Home Valuation Report is an in-depth analysis detailing your home's value as well as a comparison with similar homes in the area
Home Values in the Area
Average Home Value in this Area
Purchase History
| Date | Buyer | Sale Price | Title Company |
|---|---|---|---|
| Smith Linda M | $69,000 | Titleco Title Agency Ltd | |
| Gervse Michael J | $72,500 | -- | |
| Desciscio Marco C | $53,000 | -- | |
| Lange Linda M | $50,000 | -- | |
| Cymanski Henry A | -- | -- |
Source: Public Records
Mortgage History
| Date | Status | Borrower | Loan Amount |
|---|---|---|---|
| Open | Smith Linda M | $68,083 | |
| Previous Owner | Gervse Michael J | $65,200 |
Source: Public Records
Tax History
| Year | Tax Paid | Tax Assessment Tax Assessment Total Assessment is a certain percentage of the fair market value that is determined by local assessors to be the total taxable value of land and additions on the property. | Land | Improvement |
|---|---|---|---|---|
| 2024 | $2,992 | $38,255 | $8,330 | $29,925 |
| 2023 | $1,847 | $24,750 | $5,710 | $19,040 |
| 2022 | $1,857 | $24,750 | $5,710 | $19,040 |
| 2021 | $1,956 | $24,750 | $5,710 | $19,040 |
| 2020 | $1,495 | $19,780 | $4,550 | $15,230 |
| 2019 | $1,483 | $56,500 | $13,000 | $43,500 |
| 2018 | $1,935 | $19,780 | $4,550 | $15,230 |
| 2017 | $1,401 | $18,490 | $3,610 | $14,880 |
| 2016 | $2,492 | $18,490 | $3,610 | $14,880 |
| 2015 | $2,740 | $18,490 | $3,610 | $14,880 |
| 2014 | $2,740 | $22,540 | $4,410 | $18,130 |
Source: Public Records
Map
Nearby Homes
- 4643 E 90th St
- 4729 E 90th St
- 4723 E 94th St
- 4658 E 88th St
- 9435 Dorothy Ave
- 4762 E 90th St
- 4666 E 86th St
- 8614 Bancroft Ave
- 9722 Robinson Ave
- 4550 Effie Rd
- 4839 E 94th St
- 4850 E 90th St
- 9809 Sladden Ave
- 8304 Garfield Blvd
- 9509 Rosewood Ave
- 4864 E 94th St
- 8606 Vineyard Ave
- 8220 Garfield Blvd
- 8420 Vineyard Ave
- 8200 Garfield Blvd
- 4686 E 93rd St
- 4678 E 93rd St
- 4690 E 93rd St
- 4674 E 93rd St
- 4670 E 93rd St
- 4670 E 93rd St Unit E
- 4696 E 93rd St
- 4681 E 90th St
- 4677 E 90th St
- 4687 E 90th St
- 4662 E 93rd St
- 4691 E 90th St
- 4673 E 90th St
- 4673 E 93rd St
- 4669 E 93rd St
- 4683 E 93rd St
- 4669 E 90th St
- 4695 E 90th St
- 4693 E 93rd St
- 4704 E 93rd St