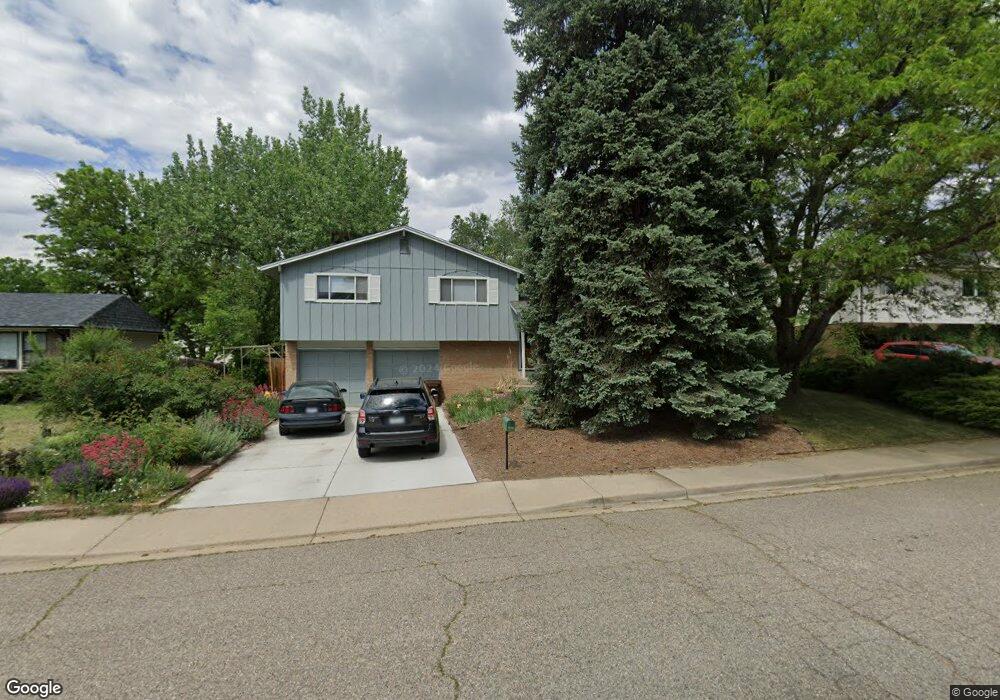
4683 Devonshire St Boulder, CO 80301
Gunbarrel NeighborhoodEstimated Value: $813,000 - $882,000
4
Beds
3
Baths
2,191
Sq Ft
$381/Sq Ft
Est. Value
About This Home
This home is located at 4683 Devonshire St, Boulder, CO 80301 and is currently estimated at $834,110, approximately $380 per square foot. 4683 Devonshire St is a home located in Boulder County with nearby schools including Heatherwood Elementary School, Nevin Platt Middle School, and Boulder High School.
Ownership History
Date
Name
Owned For
Owner Type
Purchase Details
Closed on
Jul 29, 2010
Sold by
Jamison Sharon F
Bought by
Covert Peter D
Current Estimated Value
Home Financials for this Owner
Home Financials are based on the most recent Mortgage that was taken out on this home.
Original Mortgage
$300,000
Outstanding Balance
$200,524
Interest Rate
4.76%
Mortgage Type
New Conventional
Estimated Equity
$633,586
Purchase Details
Closed on
May 10, 2004
Sold by
Graver Donald W and Graver Patricia M
Bought by
Jamison Sharon F
Home Financials for this Owner
Home Financials are based on the most recent Mortgage that was taken out on this home.
Original Mortgage
$255,920
Interest Rate
4.75%
Mortgage Type
Unknown
Purchase Details
Closed on
May 20, 1992
Bought by
Covert Peter D and Wagner Kristen D
Purchase Details
Closed on
May 31, 1990
Bought by
Covert Peter D and Wagner Kristen D
Purchase Details
Closed on
Nov 10, 1983
Bought by
Covert Peter D and Wagner Kristen D
Purchase Details
Closed on
Oct 4, 1976
Bought by
Covert Peter D and Wagner Kristen D
Create a Home Valuation Report for This Property
The Home Valuation Report is an in-depth analysis detailing your home's value as well as a comparison with similar homes in the area
Home Values in the Area
Average Home Value in this Area
Purchase History
| Date | Buyer | Sale Price | Title Company |
|---|---|---|---|
| Covert Peter D | $375,000 | Fidelity National Title Insu | |
| Jamison Sharon F | $319,900 | -- | |
| Covert Peter D | $134,000 | -- | |
| Covert Peter D | $110,000 | -- | |
| Covert Peter D | $85,500 | -- | |
| Covert Peter D | $51,000 | -- |
Source: Public Records
Mortgage History
| Date | Status | Borrower | Loan Amount |
|---|---|---|---|
| Open | Covert Peter D | $300,000 | |
| Previous Owner | Jamison Sharon F | $255,920 |
Source: Public Records
Tax History
| Year | Tax Paid | Tax Assessment Tax Assessment Total Assessment is a certain percentage of the fair market value that is determined by local assessors to be the total taxable value of land and additions on the property. | Land | Improvement |
|---|---|---|---|---|
| 2025 | $5,137 | $55,601 | $20,988 | $34,613 |
| 2024 | $5,137 | $55,601 | $20,988 | $34,613 |
| 2023 | $5,052 | $55,483 | $23,015 | $36,153 |
| 2022 | $4,266 | $43,660 | $16,916 | $26,744 |
| 2021 | $4,068 | $44,916 | $17,403 | $27,513 |
| 2020 | $3,774 | $41,198 | $15,587 | $25,611 |
| 2019 | $3,716 | $41,198 | $15,587 | $25,611 |
| 2018 | $3,338 | $36,562 | $12,960 | $23,602 |
| 2017 | $3,238 | $40,421 | $14,328 | $26,093 |
| 2016 | $2,876 | $31,490 | $12,099 | $19,391 |
| 2015 | $2,731 | $27,979 | $13,054 | $14,925 |
| 2014 | $2,724 | $27,979 | $13,054 | $14,925 |
Source: Public Records
Map
Nearby Homes
- 7750 Durham Way
- 4667 Ashfield Dr
- 4423 Alberta Ct
- 4788 Briar Ridge Trail
- 7312 Island Cir
- 4935 Sundance Square
- 4803 Briar Ridge Ct
- 4500 S Meadow Dr
- 4936 Clubhouse Cir
- 5020 Buckingham Rd Unit B2
- 5174 Buckingham Rd Unit L1
- 4620 Kirkwood St
- 4953 Clubhouse Ct
- 4422 Pali Way
- 7205 Rustic Trail
- 7481 Singing Hills Dr
- 7434 Singing Hills Ct Unit J7434
- 7447 Singing Hills Ct Unit 202
- 7443 Singing Hills Ct Unit Q
- 7411 Spy Glass Ct Unit N7411
- 4695 Devonshire St
- 4671 Devonshire St
- 4694 Chatham St
- 4670 Chatham St
- 4707 Devonshire St
- 7701 Devonshire Ct
- 4667 Devonshire St
- 4706 Chatham St
- 4658 Chatham St
- 7702 Devonshire Ct
- 7702 Essex Place
- 4719 Devonshire St
- 4657 Devonshire St
- 4718 Chatham St
- 4681 Chatham St
- 4644 Chatham St
- 7712 Essex Place
- 4646 Devonshire St
- 4669 Chatham St
- 7712 Devonshire Ct
Your Personal Tour Guide
Ask me questions while you tour the home.