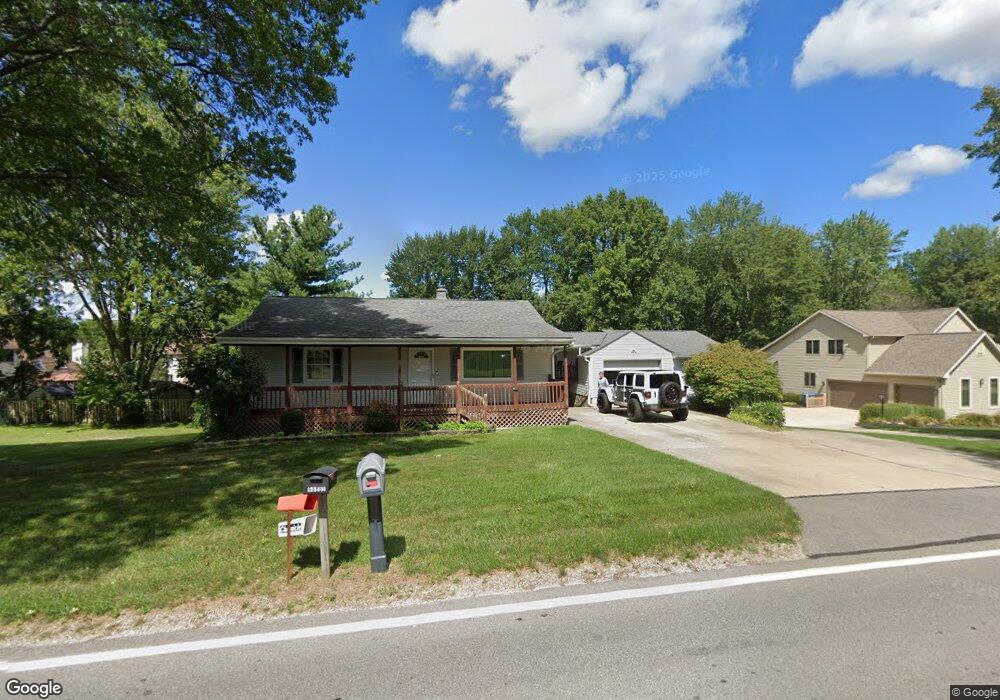
46870 Middle Ridge Rd Amherst, OH 44001
Estimated Value: $243,000 - $264,000
3
Beds
2
Baths
1,377
Sq Ft
$185/Sq Ft
Est. Value
About This Home
This home is located at 46870 Middle Ridge Rd, Amherst, OH 44001 and is currently estimated at $255,414, approximately $185 per square foot. 46870 Middle Ridge Rd is a home located in Lorain County with nearby schools including Powers Elementary School, Walter G. Nord Middle School, and Amherst Junior High School.
Ownership History
Date
Name
Owned For
Owner Type
Purchase Details
Closed on
Jul 20, 2007
Sold by
Freedman Louis A
Bought by
Velez Julio and Velez Frances
Current Estimated Value
Home Financials for this Owner
Home Financials are based on the most recent Mortgage that was taken out on this home.
Original Mortgage
$122,300
Outstanding Balance
$76,601
Interest Rate
6.54%
Mortgage Type
Purchase Money Mortgage
Estimated Equity
$178,813
Purchase Details
Closed on
Jul 12, 2005
Sold by
Citicorp Trust Bank
Bought by
Freedman Louis A
Purchase Details
Closed on
Feb 10, 2005
Sold by
Groot Lawrence R and Troot Lawrence Reed
Bought by
Cititrust Bank and Travelers Bank & Trust Fsb
Purchase Details
Closed on
May 14, 1999
Sold by
Groot Lawrence R
Bought by
Groot Lawrence R and Markovich Carol
Purchase Details
Closed on
Aug 7, 1998
Sold by
Estate Of Suzanne Elaine Groot
Bought by
Groot Lawrence R
Create a Home Valuation Report for This Property
The Home Valuation Report is an in-depth analysis detailing your home's value as well as a comparison with similar homes in the area
Home Values in the Area
Average Home Value in this Area
Purchase History
| Date | Buyer | Sale Price | Title Company |
|---|---|---|---|
| Velez Julio | $136,000 | Attorney | |
| Freedman Louis A | $108,000 | Sovereign Title Agency Llc | |
| Cititrust Bank | $99,900 | Sovereign Title Agency Llc | |
| Groot Lawrence R | -- | -- | |
| Groot Lawrence R | -- | -- |
Source: Public Records
Mortgage History
| Date | Status | Borrower | Loan Amount |
|---|---|---|---|
| Open | Velez Julio | $122,300 |
Source: Public Records
Tax History Compared to Growth
Tax History
| Year | Tax Paid | Tax Assessment Tax Assessment Total Assessment is a certain percentage of the fair market value that is determined by local assessors to be the total taxable value of land and additions on the property. | Land | Improvement |
|---|---|---|---|---|
| 2024 | $3,155 | $78,131 | $21,515 | $56,616 |
| 2023 | $3,307 | $69,031 | $16,104 | $52,927 |
| 2022 | $3,171 | $69,031 | $16,104 | $52,927 |
| 2021 | $3,179 | $69,031 | $16,104 | $52,927 |
| 2020 | $3,116 | $60,070 | $14,010 | $46,060 |
| 2019 | $3,054 | $60,070 | $14,010 | $46,060 |
| 2018 | $3,070 | $60,070 | $14,010 | $46,060 |
| 2017 | $3,080 | $56,570 | $12,330 | $44,240 |
| 2016 | $3,105 | $56,570 | $12,330 | $44,240 |
| 2015 | $3,087 | $56,570 | $12,330 | $44,240 |
| 2014 | $2,899 | $52,880 | $11,530 | $41,350 |
| 2013 | $2,909 | $52,880 | $11,530 | $41,350 |
Source: Public Records
Map
Nearby Homes
- 133 Ambleside Way
- 281 English Lakes Blvd Unit 67281
- V/L Middle Ridge Rd
- 335 Copper Creek
- 8030 Pyle South Amherst Rd
- 923 Longitude Ln
- 812 Bearing Ct
- 653 Brennan Dr
- 621 Van Oaks Dr
- 658 Nicole Dr
- 0 Middle Ridge Rd Unit 5102632
- 0 Middle Ridge Rd Unit 5160578
- 2176 Myla Way
- 814 Valley Dr
- 748 Tarry Ln
- 891 Park Ave
- 179 Jackson St
- 0 Stonebridge Dr
- 198 Oakdale Dr
- 311 Oak St Unit 311
- 46860 Middle Ridge Rd
- 46880 Middle Ridge Rd
- 46875 Middle Ridge Rd
- 193 Sleepy Hollow Dr
- 46850 Middle Ridge Rd
- 46885 Middle Ridge Rd
- 197 Sleepy Hollow Dr
- 199 Sleepy Hollow Dr
- 46840 Middle Ridge Rd
- 198 Sleepy Hollow Dr
- 46895 Middle Ridge Rd
- 46900 Middle Ridge Rd
- 46835 Middle Ridge Rd
- 76 Fallen Oaks Ln
- 74 Fallen Oaks Ln
- 106 Kristen Ct
- 104 Kristen Ct
- 72 Fallen Oaks Ln
- 101 Westchester Dr
- 109 Ambleside Way