Estimated Value: $120,000 - $173,000
3
Beds
1
Bath
1,050
Sq Ft
$136/Sq Ft
Est. Value
About This Home
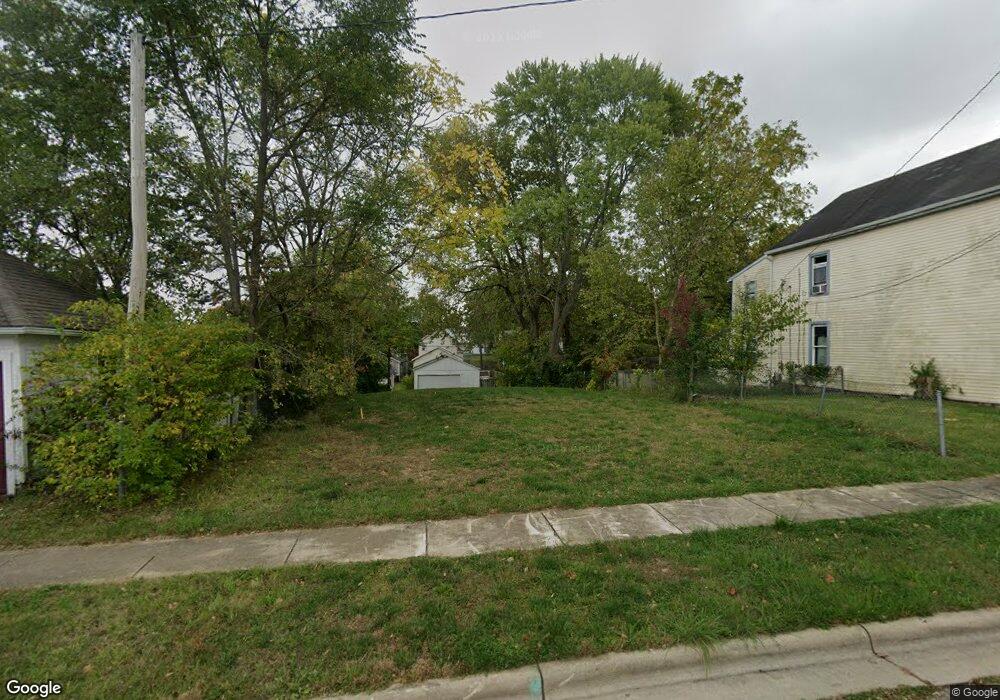
This home is located at 469 Chestnut St, Xenia, OH 45385 and is currently estimated at $143,054, approximately $136 per square foot. 469 Chestnut St is a home located in Greene County with nearby schools including Xenia High School, Summit Academy Community School for Alternative Learners - Xenia, and Legacy Christian Academy.
Ownership History
Date
Name
Owned For
Owner Type
Purchase Details
Closed on
Jun 17, 2025
Sold by
City Of Xenia
Bought by
Spahr Michael R
Current Estimated Value
Purchase Details
Closed on
Nov 7, 2002
Sold by
Roberts Scott V
Bought by
Cunningham Michael A
Home Financials for this Owner
Home Financials are based on the most recent Mortgage that was taken out on this home.
Original Mortgage
$47,200
Interest Rate
6.12%
Create a Home Valuation Report for This Property
The Home Valuation Report is an in-depth analysis detailing your home's value as well as a comparison with similar homes in the area
Home Values in the Area
Average Home Value in this Area
Purchase History
| Date | Buyer | Sale Price | Title Company |
|---|---|---|---|
| Spahr Michael R | -- | None Listed On Document | |
| Cunningham Michael A | $59,000 | -- |
Source: Public Records
Mortgage History
| Date | Status | Borrower | Loan Amount |
|---|---|---|---|
| Previous Owner | Cunningham Michael A | $47,200 | |
| Closed | Cunningham Michael A | $11,800 |
Source: Public Records
Tax History Compared to Growth
Tax History
| Year | Tax Paid | Tax Assessment Tax Assessment Total Assessment is a certain percentage of the fair market value that is determined by local assessors to be the total taxable value of land and additions on the property. | Land | Improvement |
|---|---|---|---|---|
| 2024 | $194 | $4,540 | $4,540 | $0 |
| 2023 | $194 | $4,540 | $4,540 | $0 |
| 2022 | $2,247 | $16,200 | $3,630 | $12,570 |
| 2021 | $4,511 | $16,200 | $3,630 | $12,570 |
| 2020 | $3,543 | $16,200 | $3,630 | $12,570 |
| 2019 | $1,762 | $15,270 | $3,430 | $11,840 |
| 2018 | $1,049 | $15,270 | $3,430 | $11,840 |
| 2017 | $5,948 | $15,270 | $3,430 | $11,840 |
| 2016 | $1,281 | $14,400 | $3,430 | $10,970 |
| 2015 | $3,860 | $14,400 | $3,430 | $10,970 |
| 2014 | $828 | $14,400 | $3,430 | $10,970 |
Source: Public Records
Map
Nearby Homes