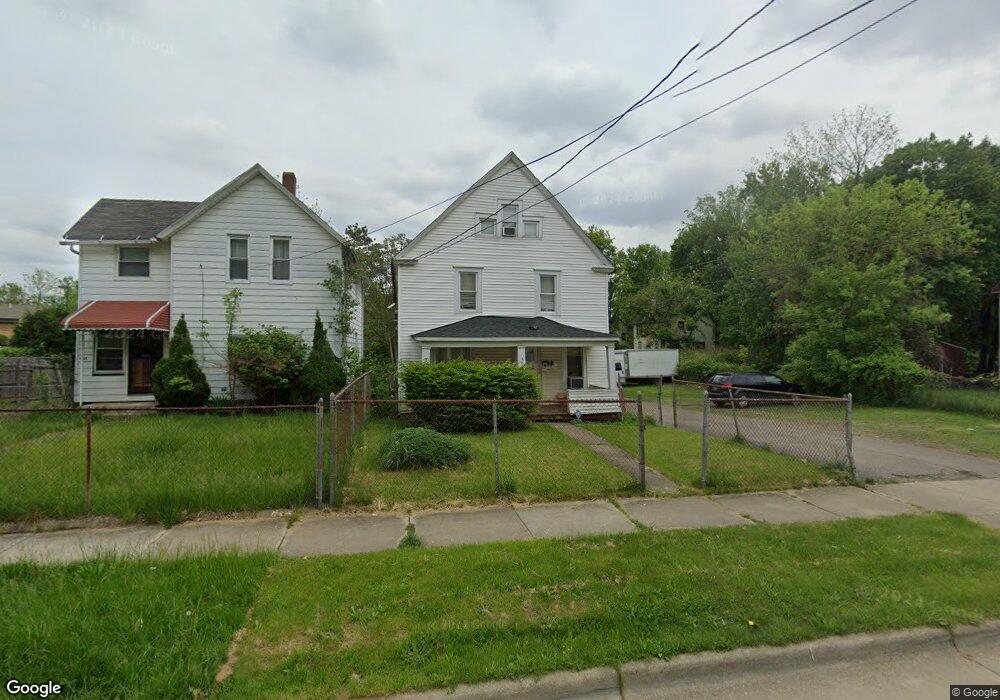
469 Douglas St Akron, OH 44307
Sherbondy Hill NeighborhoodEstimated Value: $128,104 - $174,000
4
Beds
2
Baths
2,016
Sq Ft
$74/Sq Ft
Est. Value
About This Home
This home is located at 469 Douglas St, Akron, OH 44307 and is currently estimated at $149,026, approximately $73 per square foot. 469 Douglas St is a home located in Summit County with nearby schools including Towpath Trail High School, St. Vincent Elementary School, and St Vincent-St Mary High School.
Ownership History
Date
Name
Owned For
Owner Type
Purchase Details
Closed on
Nov 27, 1999
Sold by
Mitchell Ceolia A
Bought by
Poole Natholen
Current Estimated Value
Home Financials for this Owner
Home Financials are based on the most recent Mortgage that was taken out on this home.
Original Mortgage
$20,000
Outstanding Balance
$6,181
Interest Rate
7.69%
Mortgage Type
Seller Take Back
Estimated Equity
$142,845
Create a Home Valuation Report for This Property
The Home Valuation Report is an in-depth analysis detailing your home's value as well as a comparison with similar homes in the area
Home Values in the Area
Average Home Value in this Area
Purchase History
| Date | Buyer | Sale Price | Title Company |
|---|---|---|---|
| Poole Natholen | $30,000 | Minnesota Title Agency Inc |
Source: Public Records
Mortgage History
| Date | Status | Borrower | Loan Amount |
|---|---|---|---|
| Open | Poole Natholen | $20,000 |
Source: Public Records
Tax History Compared to Growth
Tax History
| Year | Tax Paid | Tax Assessment Tax Assessment Total Assessment is a certain percentage of the fair market value that is determined by local assessors to be the total taxable value of land and additions on the property. | Land | Improvement |
|---|---|---|---|---|
| 2025 | $2,510 | $21,483 | $4,375 | $17,108 |
| 2024 | $1,205 | $21,483 | $4,375 | $17,108 |
| 2023 | $2,510 | $21,483 | $4,375 | $17,108 |
| 2022 | $1,077 | $14,981 | $2,573 | $12,408 |
| 2021 | $1,078 | $14,981 | $2,573 | $12,408 |
| 2020 | $1,063 | $14,980 | $2,570 | $12,410 |
| 2019 | $1,302 | $16,910 | $3,920 | $12,990 |
| 2018 | $1,286 | $16,910 | $3,920 | $12,990 |
| 2017 | $1,320 | $16,910 | $3,920 | $12,990 |
| 2016 | $1,321 | $17,100 | $3,920 | $13,180 |
| 2015 | $1,320 | $17,100 | $3,920 | $13,180 |
| 2014 | $1,309 | $17,100 | $3,920 | $13,180 |
| 2013 | $1,288 | $17,170 | $3,920 | $13,250 |
Source: Public Records
Map
Nearby Homes