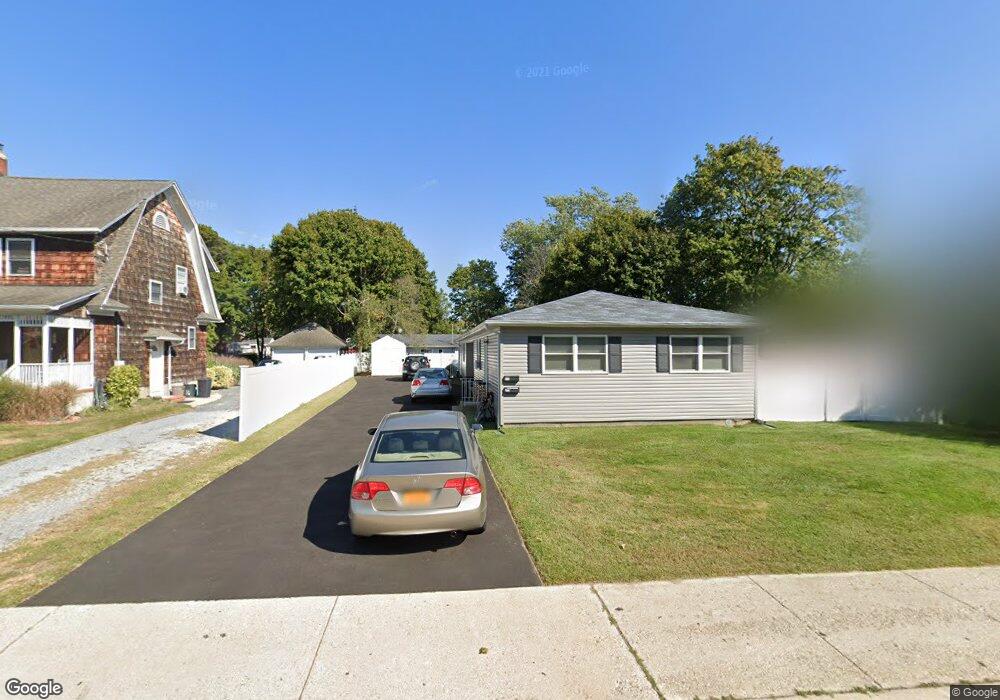
469 S Ocean Ave Patchogue, NY 11772
Estimated Value: $547,050 - $619,000
4
Beds
2
Baths
1,392
Sq Ft
$431/Sq Ft
Est. Value
About This Home
This home is located at 469 S Ocean Ave, Patchogue, NY 11772 and is currently estimated at $600,013, approximately $431 per square foot. 469 S Ocean Ave is a home located in Suffolk County with nearby schools including Patchogue-Medford High School and Holy Angels Regional School.
Ownership History
Date
Name
Owned For
Owner Type
Purchase Details
Closed on
Jul 30, 2020
Sold by
Dauria Teresa
Bought by
Clinton Baker Holdings
Current Estimated Value
Purchase Details
Closed on
Mar 21, 2015
Sold by
Smalling Terrence
Bought by
Dauria Teresa
Purchase Details
Closed on
Dec 10, 2014
Sold by
Banoni Carla
Bought by
Smalling Terrence
Purchase Details
Closed on
Aug 10, 2005
Sold by
Bruno Joseph
Bought by
Banoni Carla
Purchase Details
Closed on
Aug 23, 1999
Sold by
Bassin Nettie
Bought by
Bruno Joseph M
Home Financials for this Owner
Home Financials are based on the most recent Mortgage that was taken out on this home.
Original Mortgage
$106,600
Interest Rate
7.5%
Mortgage Type
Purchase Money Mortgage
Create a Home Valuation Report for This Property
The Home Valuation Report is an in-depth analysis detailing your home's value as well as a comparison with similar homes in the area
Home Values in the Area
Average Home Value in this Area
Purchase History
| Date | Buyer | Sale Price | Title Company |
|---|---|---|---|
| Clinton Baker Holdings | $345,000 | None Available | |
| Dauria Teresa | $170,000 | Stewart Title Insurance | |
| Smalling Terrence | $170,000 | None Available | |
| Banoni Carla | $344,550 | Chris Ross | |
| Bruno Joseph M | $118,500 | -- |
Source: Public Records
Mortgage History
| Date | Status | Borrower | Loan Amount |
|---|---|---|---|
| Previous Owner | Bruno Joseph M | $106,600 |
Source: Public Records
Tax History
| Year | Tax Paid | Tax Assessment Tax Assessment Total Assessment is a certain percentage of the fair market value that is determined by local assessors to be the total taxable value of land and additions on the property. | Land | Improvement |
|---|---|---|---|---|
| 2024 | $14,047 | $2,550 | $800 | $1,750 |
| 2023 | $10,196 | $2,550 | $800 | $1,750 |
| 2022 | $9,109 | $2,550 | $800 | $1,750 |
| 2021 | $9,109 | $2,550 | $800 | $1,750 |
| 2020 | $13,036 | $2,550 | $800 | $1,750 |
| 2019 | $12,999 | $0 | $0 | $0 |
| 2018 | $8,787 | $2,550 | $800 | $1,750 |
| 2017 | $8,787 | $2,550 | $800 | $1,750 |
| 2016 | $9,499 | $2,825 | $800 | $2,025 |
| 2015 | -- | $2,825 | $800 | $2,025 |
| 2014 | -- | $2,825 | $800 | $2,025 |
Source: Public Records
Map
Nearby Homes
Your Personal Tour Guide
Ask me questions while you tour the home.