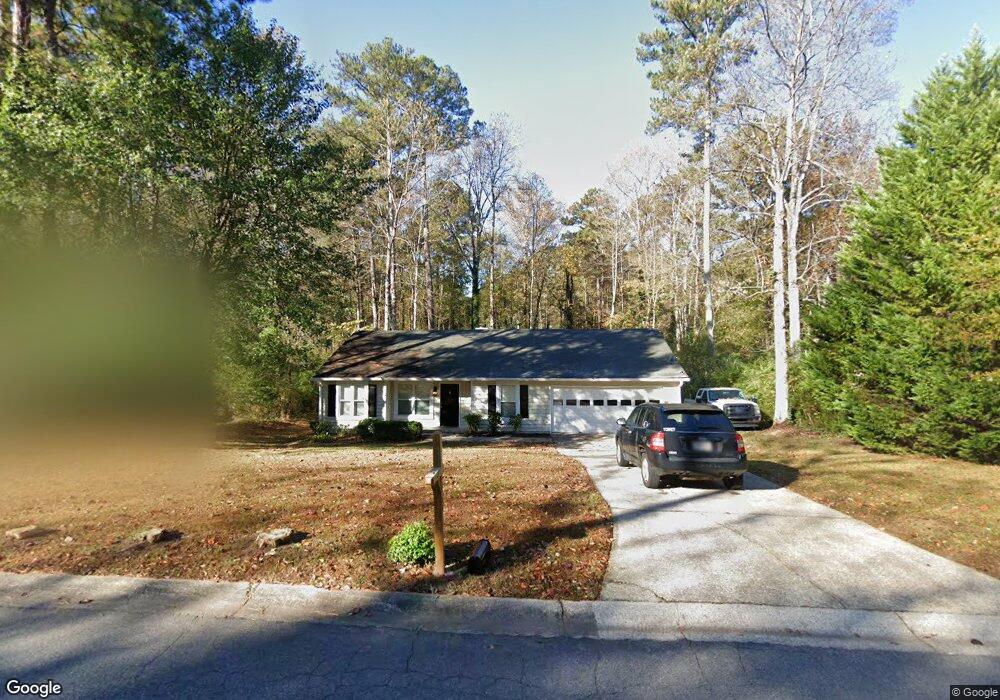
4691 Jamerson Forest Pkwy Marietta, GA 30066
Sandy Plains NeighborhoodEstimated Value: $346,000 - $364,000
3
Beds
2
Baths
1,151
Sq Ft
$306/Sq Ft
Est. Value
About This Home
This home is located at 4691 Jamerson Forest Pkwy, Marietta, GA 30066 and is currently estimated at $352,607, approximately $306 per square foot. 4691 Jamerson Forest Pkwy is a home located in Cobb County with nearby schools including Keheley Elementary School, McCleskey Middle School, and The Garden School.
Ownership History
Date
Name
Owned For
Owner Type
Purchase Details
Closed on
Aug 22, 2019
Sold by
Fro Progress Llc
Bought by
Progress Residential Borrower 10 Llc
Current Estimated Value
Purchase Details
Closed on
May 31, 2019
Sold by
Meier Thomy M
Bought by
Freo Progress Llc
Purchase Details
Closed on
May 20, 2011
Sold by
Reo Funding Solutions Llc
Bought by
Meier Thomy M and Meier Karen
Purchase Details
Closed on
Sep 7, 2010
Sold by
Coe Carlisle
Bought by
Reo Funding Solutions Llc
Purchase Details
Closed on
Aug 29, 2000
Sold by
Ker-Ley Gene S and Ker-Ley Dawn R
Bought by
Cannon Carlisle C
Home Financials for this Owner
Home Financials are based on the most recent Mortgage that was taken out on this home.
Original Mortgage
$95,600
Interest Rate
8.11%
Mortgage Type
New Conventional
Purchase Details
Closed on
Oct 6, 1994
Sold by
Dover John R
Bought by
Kerley Gene S
Home Financials for this Owner
Home Financials are based on the most recent Mortgage that was taken out on this home.
Original Mortgage
$71,421
Interest Rate
8.48%
Mortgage Type
FHA
Create a Home Valuation Report for This Property
The Home Valuation Report is an in-depth analysis detailing your home's value as well as a comparison with similar homes in the area
Home Values in the Area
Average Home Value in this Area
Purchase History
| Date | Buyer | Sale Price | Title Company |
|---|---|---|---|
| Progress Residential Borrower 10 Llc | -- | -- | |
| Freo Progress Llc | $192,000 | -- | |
| Meier Thomy M | $113,000 | -- | |
| Reo Funding Solutions Llc | $65,101 | -- | |
| Cannon Carlisle C | $119,500 | -- | |
| Kerley Gene S | $73,000 | -- |
Source: Public Records
Mortgage History
| Date | Status | Borrower | Loan Amount |
|---|---|---|---|
| Previous Owner | Cannon Carlisle C | $95,600 | |
| Previous Owner | Kerley Gene S | $71,421 |
Source: Public Records
Tax History Compared to Growth
Tax History
| Year | Tax Paid | Tax Assessment Tax Assessment Total Assessment is a certain percentage of the fair market value that is determined by local assessors to be the total taxable value of land and additions on the property. | Land | Improvement |
|---|---|---|---|---|
| 2025 | $3,549 | $117,776 | $28,800 | $88,976 |
| 2024 | $3,216 | $106,678 | $23,040 | $83,638 |
| 2023 | $3,373 | $111,888 | $23,040 | $88,848 |
| 2022 | $3,113 | $102,576 | $19,200 | $83,376 |
| 2021 | $2,507 | $82,604 | $17,600 | $65,004 |
| 2020 | $2,331 | $76,800 | $16,600 | $60,200 |
| 2019 | $1,830 | $60,312 | $14,400 | $45,912 |
| 2018 | $1,830 | $60,312 | $14,400 | $45,912 |
| 2017 | $1,708 | $59,424 | $18,000 | $41,424 |
| 2016 | $1,460 | $50,792 | $17,100 | $33,692 |
| 2015 | $1,496 | $50,792 | $17,100 | $33,692 |
| 2014 | $1,137 | $38,264 | $0 | $0 |
Source: Public Records
Map
Nearby Homes
- 4680 Jamerson Forest Pkwy
- 4791 Jamerson Forest Cir
- 1528 Forest Trace
- 1513 Jamerson Landing
- 2899 Treeside Terrace
- 4782 Jamerson Creek Ct
- 4758 Jamerson Forest Cir
- 1634 Barrier Rd
- 4422 Inlet Rd
- 4413 Inlet Rd
- 4941 Willow Ln
- 4855 Rockford Ridge Dr
- 4865 Chapelle Ct
- 1765 Blackwillow Dr
- 4262 Inlet Rd
- 4924 Locklear Way
- 4314 Keheley Lake Ct NE
- 1740 Latour Dr NE
- 4681 Jamerson Forest Pkwy
- 4703 Jamerson Forest Pkwy
- 4692 Jamerson Forest Pkwy
- 4665 Jamerson Forest Pkwy
- 4704 Jamerson Forest Pkwy
- 4715 Jamerson Forest Pkwy
- 0 Jamerson Forest Pkwy Unit 8687628
- 0 Jamerson Forest Pkwy Unit 8217925
- 0 Jamerson Forest Pkwy Unit 8183939
- 0 Jamerson Forest Pkwy Unit 7289222
- 0 Jamerson Forest Pkwy Unit 8992211
- 0 Jamerson Forest Pkwy Unit 9019738
- 0 Jamerson Forest Pkwy Unit 7173790
- 0 Jamerson Forest Pkwy
- 4674 Jamerson Creek Dr
- 4716 Jamerson Forest Pkwy
- 4686 Jamerson Creek Dr
- 4727 Jamerson Forest Pkwy
- 4662 Jamerson Creek Dr
- 4668 Jamerson Forest Pkwy