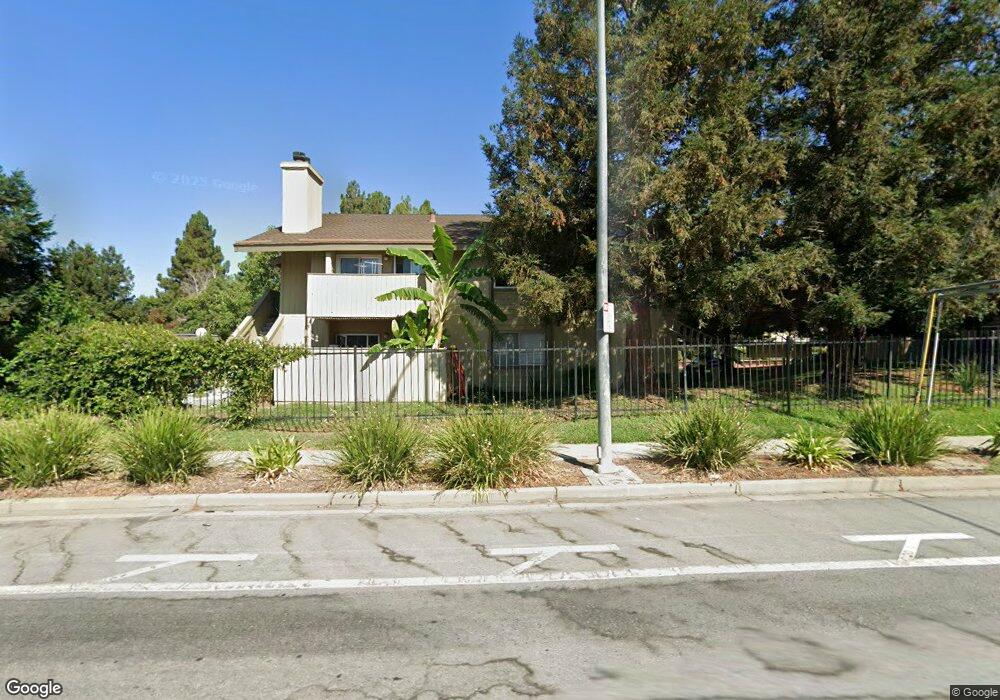
46913 Fernald Common Fremont, CA 94539
Warm Springs NeighborhoodEstimated Value: $594,868 - $636,000
2
Beds
1
Bath
937
Sq Ft
$652/Sq Ft
Est. Value
About This Home
This home is located at 46913 Fernald Common, Fremont, CA 94539 and is currently estimated at $611,217, approximately $652 per square foot. 46913 Fernald Common is a home located in Alameda County with nearby schools including James Leitch Elementary School, Warm Springs Elementary School, and John M. Horner Junior High School.
Ownership History
Date
Name
Owned For
Owner Type
Purchase Details
Closed on
Oct 2, 2010
Sold by
Kan Jiaxi and Fan Jingzhi
Bought by
Kan & Fan Revocable Living Trust
Current Estimated Value
Purchase Details
Closed on
Oct 1, 2009
Sold by
Wells Fargo Bank Na
Bought by
Kan Jiaxi and Fan Jingzhi
Purchase Details
Closed on
Apr 1, 2009
Sold by
Dimaggio Bond Jennifer A and Bond Thomas L
Bought by
Wells Fargo Bank Na
Purchase Details
Closed on
Jun 26, 2006
Sold by
Fisher Jason L and Fisher Shelly L
Bought by
Bond Thomas and Bond Jennifer Di Maggio
Home Financials for this Owner
Home Financials are based on the most recent Mortgage that was taken out on this home.
Original Mortgage
$401,000
Interest Rate
7.4%
Mortgage Type
Purchase Money Mortgage
Purchase Details
Closed on
Jun 6, 2002
Sold by
Fisher Jason L and Fisher Shelly L
Bought by
Fisher Jason L and Fisher Shelly L
Home Financials for this Owner
Home Financials are based on the most recent Mortgage that was taken out on this home.
Original Mortgage
$248,437
Interest Rate
6.83%
Mortgage Type
Stand Alone First
Create a Home Valuation Report for This Property
The Home Valuation Report is an in-depth analysis detailing your home's value as well as a comparison with similar homes in the area
Home Values in the Area
Average Home Value in this Area
Purchase History
| Date | Buyer | Sale Price | Title Company |
|---|---|---|---|
| Kan & Fan Revocable Living Trust | -- | None Available | |
| Kan Jiaxi | $214,000 | Lsi Title Company | |
| Wells Fargo Bank Na | $199,000 | None Available | |
| Bond Thomas | $401,000 | Fidelity National Title Co | |
| Fisher Jason L | -- | Fidelity National Title |
Source: Public Records
Mortgage History
| Date | Status | Borrower | Loan Amount |
|---|---|---|---|
| Previous Owner | Bond Thomas | $401,000 | |
| Previous Owner | Fisher Jason L | $248,437 |
Source: Public Records
Tax History Compared to Growth
Tax History
| Year | Tax Paid | Tax Assessment Tax Assessment Total Assessment is a certain percentage of the fair market value that is determined by local assessors to be the total taxable value of land and additions on the property. | Land | Improvement |
|---|---|---|---|---|
| 2025 | $3,789 | $276,215 | $82,864 | $193,351 |
| 2024 | $3,789 | $270,801 | $81,240 | $189,561 |
| 2023 | $3,676 | $265,491 | $79,647 | $185,844 |
| 2022 | $3,611 | $260,287 | $78,086 | $182,201 |
| 2021 | $3,533 | $255,185 | $76,555 | $178,630 |
| 2020 | $3,473 | $252,570 | $75,771 | $176,799 |
| 2019 | $3,437 | $247,618 | $74,285 | $173,333 |
| 2018 | $3,369 | $242,765 | $72,829 | $169,936 |
| 2017 | $3,286 | $238,005 | $71,401 | $166,604 |
| 2016 | $3,220 | $233,340 | $70,002 | $163,338 |
| 2015 | $3,165 | $229,837 | $68,951 | $160,886 |
| 2014 | $3,112 | $225,337 | $67,601 | $157,736 |
Source: Public Records
Map
Nearby Homes
- 524 E Warren Ave
- 46869 Fernald Common Unit 38
- 46867 Fernald Common
- 199 E Warren Common
- 46762 Winema Common
- 281 Hackamore Common
- 136 Hackamore Ln Unit 18
- 47236 Cavanaugh Common
- 46935 Aloe Ct
- 46925 Aloe Ct
- 45897 Bridgeport Place
- 130 Kootenai Dr
- 2250 Kilowatt Way Unit 214
- 1748 Kilowatt Way Unit 301
- 45258 Tom Blalock St Unit 100
- 48346 Cottonwood St
- 45128 Warm Springs Blvd Unit 523
- 45128 Warm Springs Blvd Unit 323
- 48287 Sawleaf St
- 3512 Vision Common Unit 308
- 46915 Fernald Common
- 46911 Fernald Common
- 46909 Fernald Common
- 46909 Fernald Common
- 46917 Fernald Common
- 46919 Fernald Common
- 46881 Fernald Common
- 46921 Fernald Common
- 46872 Fernald Common
- 46887 Fernald Common
- 46879 Fernald Common Unit K
- 46879 Fernald Common
- 46923 Fernald Common Unit 59
- 46877 Fernald Common Unit 42
- 46905 Fernald Common
- 46889 Fernald Common
- 46885 Fernald Common
- 46883 Fernald Common
- 46903 Fernald Common Unit 50
- 46875 Fernald Common