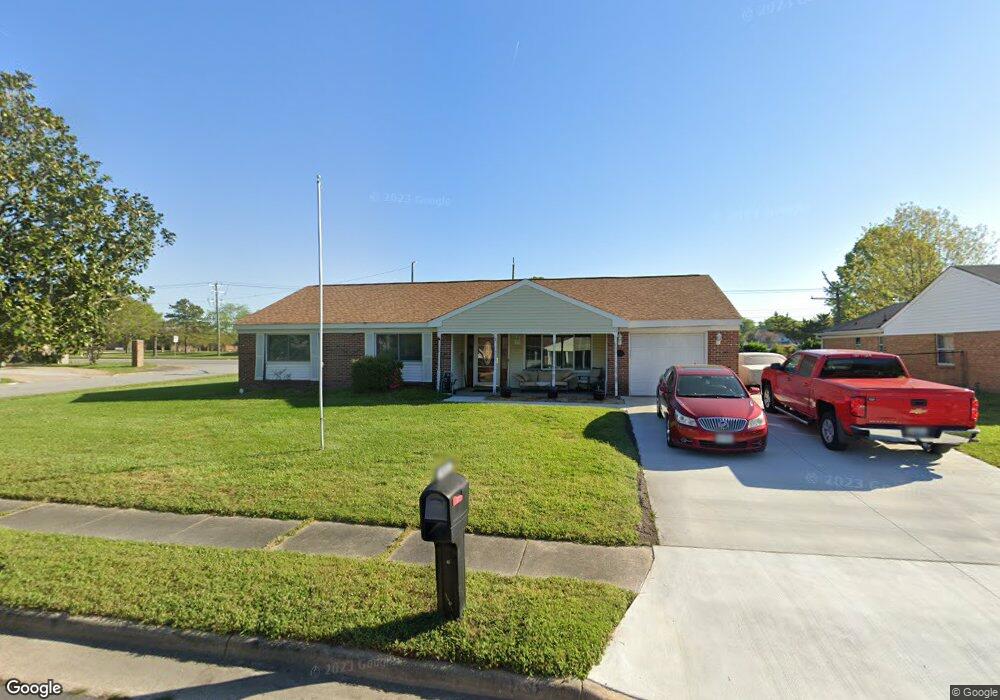
4698 Hanover Ct Virginia Beach, VA 23464
Estimated Value: $393,000 - $424,000
3
Beds
2
Baths
1,707
Sq Ft
$240/Sq Ft
Est. Value
About This Home
This home is located at 4698 Hanover Ct, Virginia Beach, VA 23464 and is currently estimated at $409,769, approximately $240 per square foot. 4698 Hanover Ct is a home located in Virginia Beach City with nearby schools including Providence Elementary School, Kempsville Middle School, and Kempsville High School.
Ownership History
Date
Name
Owned For
Owner Type
Purchase Details
Closed on
Aug 7, 2009
Sold by
Sec Of Veterans Affairs
Bought by
Grosz Douglas G
Current Estimated Value
Home Financials for this Owner
Home Financials are based on the most recent Mortgage that was taken out on this home.
Original Mortgage
$223,771
Interest Rate
5.31%
Mortgage Type
FHA
Purchase Details
Closed on
Oct 23, 2008
Sold by
Modes Bruce
Bought by
Sec Of Veterans Affairs
Purchase Details
Closed on
Nov 30, 2005
Sold by
Disch David
Bought by
Modes Bruce
Home Financials for this Owner
Home Financials are based on the most recent Mortgage that was taken out on this home.
Original Mortgage
$245,000
Interest Rate
6.17%
Mortgage Type
VA
Purchase Details
Closed on
Jan 9, 2002
Sold by
Viau Robert W
Bought by
Disch Dvid B
Home Financials for this Owner
Home Financials are based on the most recent Mortgage that was taken out on this home.
Original Mortgage
$137,532
Interest Rate
7.04%
Create a Home Valuation Report for This Property
The Home Valuation Report is an in-depth analysis detailing your home's value as well as a comparison with similar homes in the area
Home Values in the Area
Average Home Value in this Area
Purchase History
| Date | Buyer | Sale Price | Title Company |
|---|---|---|---|
| Grosz Douglas G | $227,900 | -- | |
| Sec Of Veterans Affairs | $236,189 | -- | |
| Modes Bruce | $245,000 | -- | |
| Disch Dvid B | $139,700 | -- |
Source: Public Records
Mortgage History
| Date | Status | Borrower | Loan Amount |
|---|---|---|---|
| Previous Owner | Grosz Douglas G | $223,771 | |
| Previous Owner | Modes Bruce | $245,000 | |
| Previous Owner | Disch Dvid B | $137,532 |
Source: Public Records
Tax History Compared to Growth
Tax History
| Year | Tax Paid | Tax Assessment Tax Assessment Total Assessment is a certain percentage of the fair market value that is determined by local assessors to be the total taxable value of land and additions on the property. | Land | Improvement |
|---|---|---|---|---|
| 2025 | $3,176 | $339,700 | $165,000 | $174,700 |
| 2024 | $3,176 | $327,400 | $165,000 | $162,400 |
| 2023 | $3,078 | $310,900 | $141,800 | $169,100 |
| 2022 | $3,078 | $310,900 | $141,800 | $169,100 |
| 2021 | $2,554 | $258,000 | $105,000 | $153,000 |
| 2020 | $2,433 | $239,100 | $105,000 | $134,100 |
| 2019 | $2,511 | $244,100 | $105,000 | $139,100 |
| 2018 | $2,447 | $244,100 | $105,000 | $139,100 |
| 2017 | $2,355 | $234,900 | $100,000 | $134,900 |
| 2016 | $2,363 | $238,700 | $101,000 | $137,700 |
| 2015 | $2,261 | $228,400 | $97,600 | $130,800 |
| 2014 | $2,157 | $246,200 | $114,800 | $131,400 |
Source: Public Records
Map
Nearby Homes
- 816 Moffat Ln
- 808 Sussex Ct
- 828 Timberlake Dr
- 920 Hanover Dr
- 765 Pine Lake Dr
- 4865 Admiration Dr
- 4769 Marlborough Dr
- 4512 Shallowford Cir
- 1108 Flobert Dr
- 4857 Haymarket Dr
- 617 New Lake Ct
- 937 Lehman Dr
- 4477 Brinker Dr
- 624 Pinebrook Dr
- 613 Rock Spring Ct
- 4684 Larkwood Dr
- 1121 Selwood Dr
- 4732 Kempsville Greens Pkwy
- 4724 Kempsville Greens Pkwy
- 1501 Stonemoss Ct
- 4694 Hanover Ct
- 801 Hanover Dr
- 4699 Hanover Ct
- 805 Hanover Dr
- 4690 Hanover Ct
- 4695 Hanover Ct
- 809 Hanover Dr
- 4691 Hanover Ct
- 800 Oldham Rd
- 804 Oldham Rd
- 4698 Steeplechase Dr
- 801 Yearling Ct
- 813 Hanover Dr
- 808 Oldham Rd
- 4694 Steeplechase Dr
- 805 Yearling Ct
- 4690 Steeplechase Dr
- 812 Oldham Rd
- 809 Yearling Ct
- 817 Hanover Dr