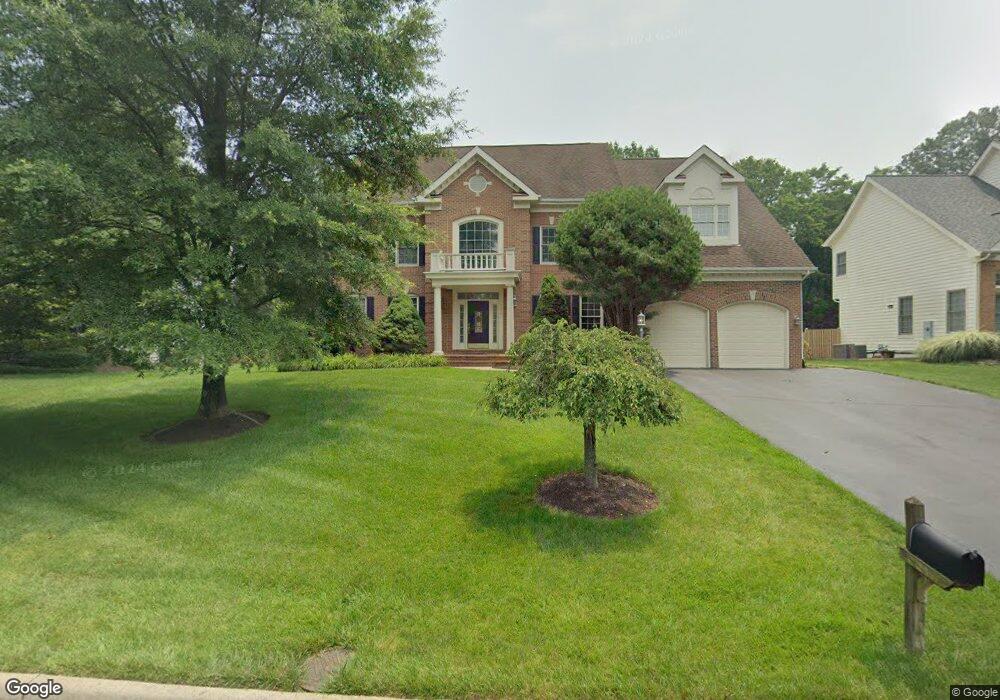
4699 Autumn Glory Way Chantilly, VA 20151
Estimated Value: $1,377,000 - $1,441,789
4
Beds
5
Baths
3,920
Sq Ft
$360/Sq Ft
Est. Value
About This Home
This home is located at 4699 Autumn Glory Way, Chantilly, VA 20151 and is currently estimated at $1,410,447, approximately $359 per square foot. 4699 Autumn Glory Way is a home located in Fairfax County with nearby schools including Poplar Tree Elementary, Rocky Run Middle School, and Chantilly High School.
Ownership History
Date
Name
Owned For
Owner Type
Purchase Details
Closed on
Aug 19, 2005
Sold by
Pascarella Francis
Bought by
Al Karagholi Mustafa and Doohi,Dunia
Current Estimated Value
Home Financials for this Owner
Home Financials are based on the most recent Mortgage that was taken out on this home.
Original Mortgage
$824,000
Outstanding Balance
$432,858
Interest Rate
5.66%
Mortgage Type
New Conventional
Estimated Equity
$977,589
Purchase Details
Closed on
Aug 17, 2000
Sold by
Robert B Jordan Of Va Inc
Bought by
Pascerell Francis
Home Financials for this Owner
Home Financials are based on the most recent Mortgage that was taken out on this home.
Original Mortgage
$427,550
Interest Rate
8.13%
Mortgage Type
Purchase Money Mortgage
Create a Home Valuation Report for This Property
The Home Valuation Report is an in-depth analysis detailing your home's value as well as a comparison with similar homes in the area
Home Values in the Area
Average Home Value in this Area
Purchase History
| Date | Buyer | Sale Price | Title Company |
|---|---|---|---|
| Al Karagholi Mustafa | $1,030,000 | -- | |
| Pascerell Francis | $535,097 | -- |
Source: Public Records
Mortgage History
| Date | Status | Borrower | Loan Amount |
|---|---|---|---|
| Open | Al Karagholi Mustafa | $824,000 | |
| Previous Owner | Pascerell Francis | $427,550 |
Source: Public Records
Tax History Compared to Growth
Tax History
| Year | Tax Paid | Tax Assessment Tax Assessment Total Assessment is a certain percentage of the fair market value that is determined by local assessors to be the total taxable value of land and additions on the property. | Land | Improvement |
|---|---|---|---|---|
| 2025 | $13,756 | $1,257,050 | $372,000 | $885,050 |
| 2024 | $13,756 | $1,187,440 | $362,000 | $825,440 |
| 2023 | $13,137 | $1,164,090 | $362,000 | $802,090 |
| 2022 | $12,261 | $1,072,270 | $352,000 | $720,270 |
| 2021 | $11,034 | $940,270 | $327,000 | $613,270 |
| 2020 | $10,827 | $914,790 | $317,000 | $597,790 |
| 2019 | $10,504 | $887,510 | $307,000 | $580,510 |
| 2018 | $9,276 | $806,590 | $304,000 | $502,590 |
| 2017 | $9,365 | $806,590 | $304,000 | $502,590 |
| 2016 | $9,344 | $806,590 | $304,000 | $502,590 |
| 2015 | $8,652 | $775,260 | $292,000 | $483,260 |
| 2014 | $8,633 | $775,260 | $292,000 | $483,260 |
Source: Public Records
Map
Nearby Homes
- 4511 Stone Pine Ct
- 4503 Stone Pine Ct
- 4521 Waverly Crossing Ln
- 4309 Willoughby Ct
- 4528 Waverly Crossing Ln
- 4427 Majestic Ln
- 4627 Deerwatch Dr
- 4619 Olivine Dr
- 14130 Gypsum Loop
- 13711 Penwith Ct
- 14303 Yesler Ave
- 5127 Woodfield Dr
- 4902 Longmire Way Unit 24
- 5105 Wyndham Rose Cove Unit 115
- 13611 British Manor Ct
- 14423 Glencrest Cir Unit 123
- 5100 Castle Harbor Way Unit 117
- 14437 Glencrest Cir Unit 129
- 4006 Novar Dr
- 5417 Gladewright Dr
- 4701 Autumn Glory Way
- 4697 Autumn Glory Way
- 4703 Autumn Glory Way
- 4695 Autumn Glory Way
- 4698 Autumn Glory Way
- 4700 Autumn Glory Way
- 4622 Sutton Oaks Dr
- 4620 Sutton Oaks Dr
- 4702 Autumn Glory Way
- 4618 Sutton Oaks Dr
- 4705 Autumn Glory Way
- 4624 Sutton Oaks Dr
- 4693 Autumn Glory Way
- 4694 Autumn Glory Way
- 13750 Royal Red Terrace
- 4628 Sutton Oaks Dr
- 13879 Lewis Mill Way
- 4616 Sutton Oaks Dr
- 4707 Autumn Glory Way
- 13878 Lewis Mill Way