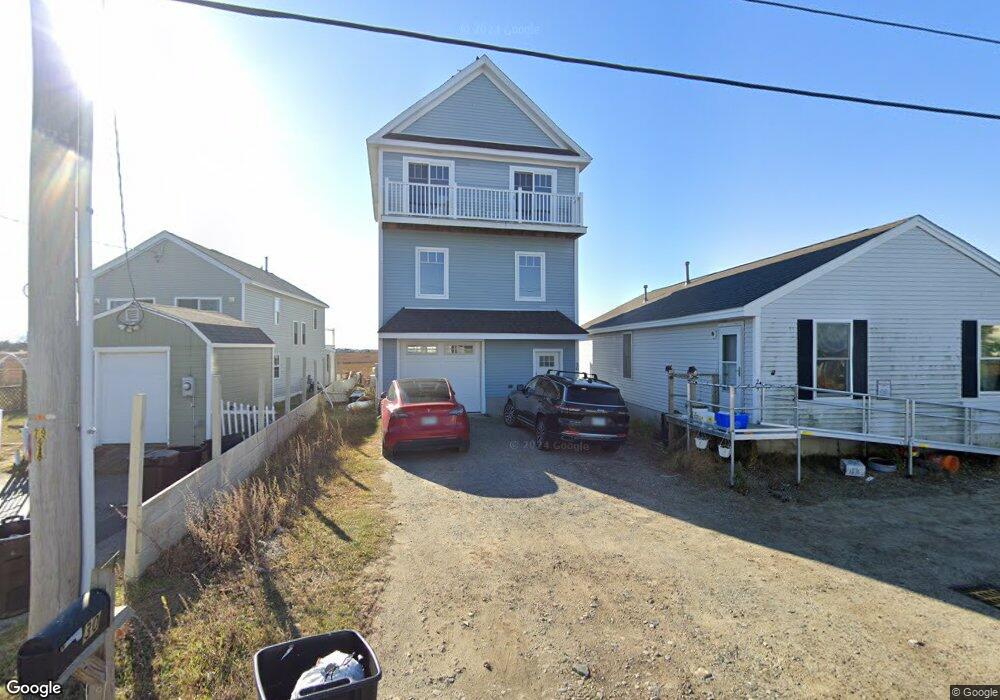
46A River St Unit 46a Seabrook, NH 03874
Seabrook Beach NeighborhoodEstimated Value: $741,791 - $880,000
3
Beds
3
Baths
1,930
Sq Ft
$404/Sq Ft
Est. Value
About This Home
This home is located at 46A River St Unit 46a, Seabrook, NH 03874 and is currently estimated at $778,948, approximately $403 per square foot. 46A River St Unit 46a is a home located in Rockingham County with nearby schools including Seabrook Elementary School, Seabrook Middle School, and Winnacunnet High School.
Ownership History
Date
Name
Owned For
Owner Type
Purchase Details
Closed on
Dec 15, 2015
Sold by
Barone Arlene and Barone Ava M
Bought by
Margaret A King Ret and King
Current Estimated Value
Home Financials for this Owner
Home Financials are based on the most recent Mortgage that was taken out on this home.
Original Mortgage
$205,500
Outstanding Balance
$164,118
Interest Rate
3.77%
Mortgage Type
New Conventional
Estimated Equity
$614,830
Create a Home Valuation Report for This Property
The Home Valuation Report is an in-depth analysis detailing your home's value as well as a comparison with similar homes in the area
Home Values in the Area
Average Home Value in this Area
Purchase History
| Date | Buyer | Sale Price | Title Company |
|---|---|---|---|
| Margaret A King Ret | $388,866 | -- | |
| Margaret A King Ret | $388,866 | -- |
Source: Public Records
Mortgage History
| Date | Status | Borrower | Loan Amount |
|---|---|---|---|
| Open | Margaret A King Ret | $205,500 | |
| Closed | Margaret A King Ret | $205,500 | |
| Previous Owner | Margaret A King Ret | $216,000 |
Source: Public Records
Tax History Compared to Growth
Tax History
| Year | Tax Paid | Tax Assessment Tax Assessment Total Assessment is a certain percentage of the fair market value that is determined by local assessors to be the total taxable value of land and additions on the property. | Land | Improvement |
|---|---|---|---|---|
| 2024 | $8,608 | $734,500 | $239,900 | $494,600 |
| 2023 | $8,123 | $538,300 | $180,200 | $358,100 |
| 2022 | $7,132 | $538,300 | $180,200 | $358,100 |
| 2021 | $7,391 | $538,300 | $180,200 | $358,100 |
| 2020 | $6,374 | $399,100 | $145,000 | $254,100 |
| 2019 | $6,114 | $388,200 | $134,100 | $254,100 |
| 2018 | $6,546 | $402,800 | $148,700 | $254,100 |
| 2017 | $5,822 | $358,300 | $104,200 | $254,100 |
| 2016 | $5,282 | $357,100 | $104,200 | $252,900 |
| 2015 | $4,922 | $332,800 | $97,600 | $235,200 |
| 2014 | $5,082 | $332,800 | $97,600 | $235,200 |
| 2013 | $5,082 | $332,800 | $97,600 | $235,200 |
Source: Public Records
Map
Nearby Homes
- 18 River St
- 376 Ocean Blvd
- 27 Cross Beach Rd
- 9 Tyngsboro St
- 8 Portsmouth Ave
- 387 Ocean Blvd
- 308 State Route 286 Unit Lot 73
- 308 State Route 286 Unit Lot 108
- 308 State Route 286 Unit Lot 87
- 13-15 Ocean Blvd
- 13 Ocean Blvd
- 15 Ocean Blvd
- 595 N End Blvd Unit 2
- 3 Harris Ave
- 5 Fellows Ave
- 19 Riverview Terrace
- 13 Riverview Terrace Unit B
- 308 Route 286 Unit 77
- 308 Route 286 Unit Lot 58
- 10 Haverhill Ave Unit 1