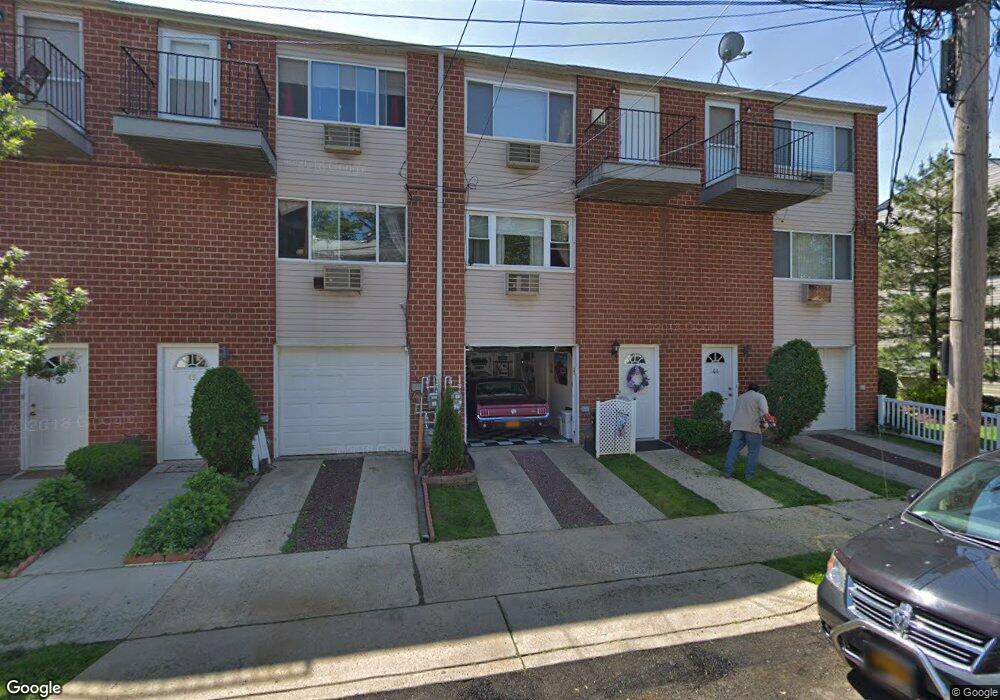
46B Francine Ct Unit 86B Staten Island, NY 10306
New Dorp NeighborhoodEstimated Value: $271,113 - $318,000
--
Bed
--
Bath
638
Sq Ft
$464/Sq Ft
Est. Value
About This Home
This home is located at 46B Francine Ct Unit 86B, Staten Island, NY 10306 and is currently estimated at $295,778, approximately $463 per square foot. 46B Francine Ct Unit 86B is a home located in Richmond County with nearby schools including P.S. 41 The Stephanie a Vierno School, Is 2 George L Egbert, and New Dorp High School.
Ownership History
Date
Name
Owned For
Owner Type
Purchase Details
Closed on
Nov 21, 2017
Sold by
Fruscione Joseph
Bought by
Lisanti Andrew E
Current Estimated Value
Home Financials for this Owner
Home Financials are based on the most recent Mortgage that was taken out on this home.
Original Mortgage
$144,900
Outstanding Balance
$121,707
Interest Rate
3.94%
Mortgage Type
New Conventional
Estimated Equity
$174,071
Purchase Details
Closed on
Apr 12, 2005
Sold by
Amato Victor and Amato Norma
Bought by
Fruscione Joseph
Purchase Details
Closed on
Sep 9, 1999
Sold by
Chordia Pratap and Chordia Usha
Bought by
Amato Victor and Amato Norma
Home Financials for this Owner
Home Financials are based on the most recent Mortgage that was taken out on this home.
Original Mortgage
$34,500
Interest Rate
8.24%
Mortgage Type
Purchase Money Mortgage
Create a Home Valuation Report for This Property
The Home Valuation Report is an in-depth analysis detailing your home's value as well as a comparison with similar homes in the area
Home Values in the Area
Average Home Value in this Area
Purchase History
| Date | Buyer | Sale Price | Title Company |
|---|---|---|---|
| Lisanti Andrew E | $204,900 | Old Republic National Title | |
| Fruscione Joseph | $150,000 | Commonwealth Title | |
| Fruscione Joseph | $150,000 | Commonwealth Title | |
| Amato Victor | $46,000 | First American Title Ins Co |
Source: Public Records
Mortgage History
| Date | Status | Borrower | Loan Amount |
|---|---|---|---|
| Open | Lisanti Andrew E | $144,900 | |
| Previous Owner | Amato Victor | $34,500 |
Source: Public Records
Tax History Compared to Growth
Tax History
| Year | Tax Paid | Tax Assessment Tax Assessment Total Assessment is a certain percentage of the fair market value that is determined by local assessors to be the total taxable value of land and additions on the property. | Land | Improvement |
|---|---|---|---|---|
| 2025 | $1,992 | $20,814 | $473 | $20,341 |
| 2024 | $1,992 | $18,296 | $533 | $17,763 |
| 2023 | $1,901 | $9,358 | $540 | $8,818 |
| 2022 | $1,763 | $15,164 | $984 | $14,180 |
| 2021 | $1,753 | $15,014 | $984 | $14,030 |
| 2020 | $1,763 | $14,502 | $984 | $13,518 |
| 2019 | $1,729 | $14,502 | $984 | $13,518 |
| 2018 | $1,590 | $7,798 | $633 | $7,165 |
| 2017 | $1,500 | $7,358 | $648 | $6,710 |
| 2016 | $1,388 | $6,942 | $658 | $6,284 |
| 2015 | $1,322 | $6,942 | $608 | $6,334 |
| 2014 | $1,322 | $6,888 | $722 | $6,166 |
Source: Public Records
Map
Nearby Homes
- 46 Francine Ct Unit B
- 46 Francine Ct Unit A
- 48 Francine Ct Unit A
- 48 Francine Ct Unit B
- 44B Francine Ct Unit 88B
- 44A Francine Ct Unit 88A
- 44 Francine Ct Unit A
- 44 Francine Ct Unit B
- 46A Francine Ct Unit 86A
- 58B Francine Ct Unit 74B
- 58A Francine Ct Unit 74A
- 50A Francine Ct Unit 82A
- 50 Francine Ct Unit A
- 50 Francine Ct Unit B
- 50 Francine Ct
- 52B Francine Ct Unit 80B
- 27A Francine Ct
- 28A Francine Ct Unit 102A
- 30B Francine Ct Unit 100B
- 30A Francine Ct Unit 100A