47 Balmoral St Unit 49 Andover, MA 01810
Shawsheen Heights NeighborhoodEstimated Value: $1,169,000 - $1,935,000
About This Home
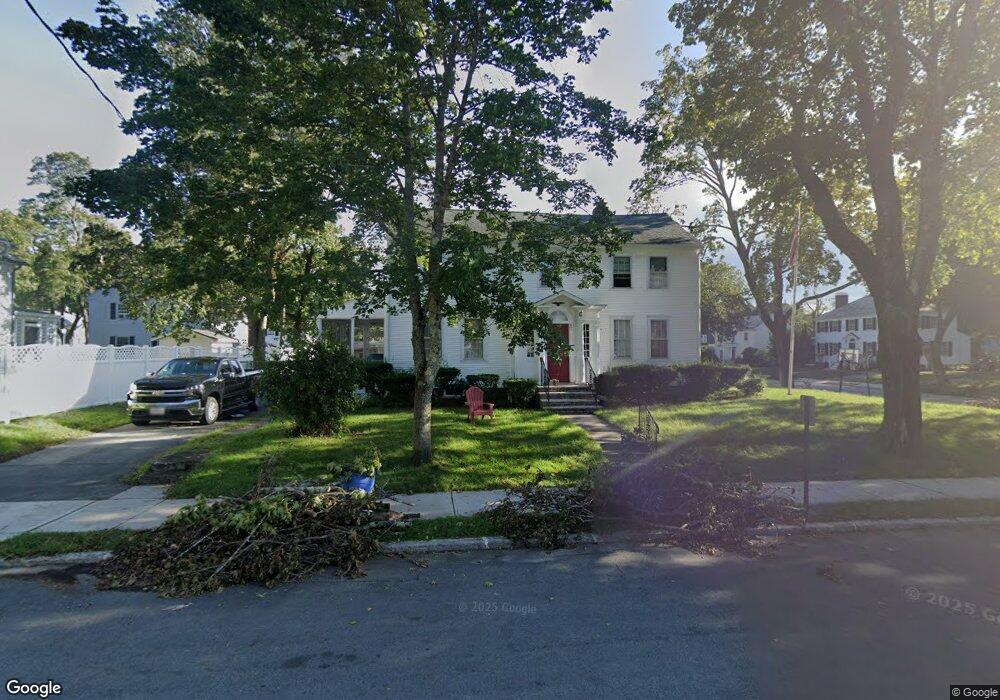
This home is located at 47 Balmoral St Unit 49, Andover, MA 01810 and is currently estimated at $1,543,831, approximately $369 per square foot. 47 Balmoral St Unit 49 is a home located in Essex County with nearby schools including West Elementary School, Andover West Middle School, and Andover High School.
Ownership History
We collect this data history from publicly available records. To have your information removed, we recommend requesting removal directly through your county’s website.
Purchase Details
Purchase Details
Home Values in the Area
Average Home Value in this Area
Purchase History
We collect this data history from publicly available records. To have your information removed, we recommend requesting removal directly through your county’s website.
| Date | Buyer | Sale Price | Title Company |
|---|---|---|---|
| -- | None Available | ||
| -- | None Available | ||
| -- | -- | ||
| -- | -- |
Mortgage History
We collect this data history from publicly available records. To have your information removed, we recommend requesting removal directly through your county’s website.
| Date | Status | Borrower | Loan Amount |
|---|---|---|---|
| Previous Owner | $205,000 |
Tax History
We collect this data history from publicly available records. To have your information removed, we recommend requesting removal directly through your county’s website.
| Year | Tax Paid | Tax Assessment Tax Assessment Total Assessment is a certain percentage of the fair market value that is determined by local assessors to be the total taxable value of land and additions on the property. | Land | Improvement |
|---|---|---|---|---|
| 2025 | $14,101 | $1,129,000 | $467,300 | $661,700 |
| 2024 | $14,513 | $1,126,800 | $428,100 | $698,700 |
| 2023 | $12,549 | $918,700 | $385,600 | $533,100 |
| 2022 | $11,100 | $760,300 | $341,300 | $419,000 |
| 2021 | $10,627 | $695,000 | $310,200 | $384,800 |
| 2020 | $9,955 | $663,200 | $302,700 | $360,500 |
| 2019 | $9,457 | $619,300 | $290,900 | $328,400 |
| 2018 | $9,020 | $576,700 | $274,300 | $302,400 |
| 2017 | $8,100 | $533,600 | $268,900 | $264,700 |
| 2016 | $7,431 | $501,400 | $268,900 | $232,500 |
| 2015 | $7,355 | $491,300 | $258,700 | $232,600 |
Map
- 60 Haverhill St
- 7 Rock o Dundee Rd
- 90 Washington Park Dr Unit 1
- 80 B Washington Park Dr Unit 7
- 80 A Washington Park Dr Unit 1
- 80 Washington Park Dr Unit 6
- 60A Washington Park Dr Unit 2
- 70 Washington Park Dr Unit 6
- 20 Washington Park Dr Unit 12
- 16R High St
- 15-17 Stirling St
- 39 Smithshire Estates
- 10 Crescent Dr Unit 6
- 11 Longwood Dr Unit 7
- 21 William St
- 9 Longwood Dr Unit 1
- 2 Powder Mill Square Unit 2B
- 72 High St
- 12 Burton Farm Dr
- 90 Lowell St
- 14 Argyle St
- 12 Argyle St
- 16 Argyle St
- 13 Carisbrooke St
- 15 Carisbrooke St
- 11 Carisbrooke St
- 10 Argyle St
- 18 Argyle St
- 15 Argyle St
- 13 Argyle St
- 17 Argyle St
- 11 Argyce St
- 9 Carisbrooke St
- 19 Carisbrooke St
- 19 Carisbrooke St Unit 1
- 8 Argyle St
- 19 Argyle St
- 20 Argyle St
- 39 Balmoral St Unit 41
- 16 Arundel St
Ask me questions while you tour the home.