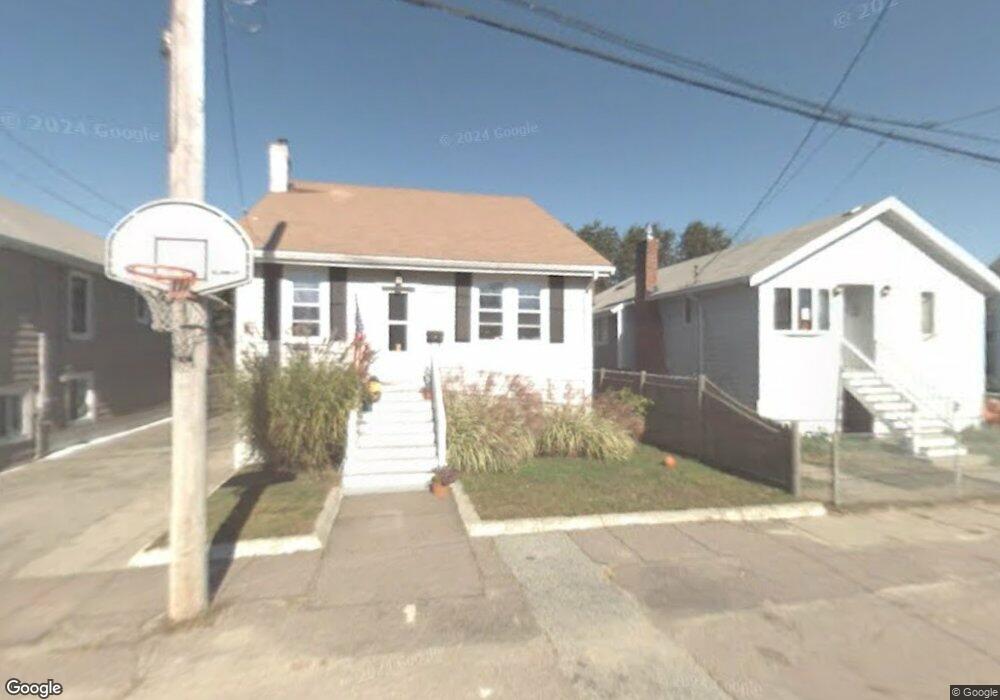
47 Bates St Hull, MA 02045
Whitehead NeighborhoodEstimated Value: $476,000 - $593,000
3
Beds
2
Baths
1,210
Sq Ft
$446/Sq Ft
Est. Value
About This Home
This home is located at 47 Bates St, Hull, MA 02045 and is currently estimated at $539,281, approximately $445 per square foot. 47 Bates St is a home located in Plymouth County with nearby schools including Lillian M. Jacobs Elementary School, Memorial Middle School, and Hull High School.
Ownership History
Date
Name
Owned For
Owner Type
Purchase Details
Closed on
Feb 2, 2011
Sold by
Karski Anna M
Bought by
Karski Anna M
Current Estimated Value
Home Financials for this Owner
Home Financials are based on the most recent Mortgage that was taken out on this home.
Original Mortgage
$201,000
Outstanding Balance
$137,801
Interest Rate
4.82%
Mortgage Type
Purchase Money Mortgage
Estimated Equity
$401,480
Purchase Details
Closed on
Sep 29, 2000
Sold by
Moran Michael J and Moran Kritin B
Bought by
Karski Mark A and Karski Anna M
Purchase Details
Closed on
Mar 16, 1998
Sold by
Tullish John J and Tullish Beverly I
Bought by
Moran Michael J and Moran Kristin B
Create a Home Valuation Report for This Property
The Home Valuation Report is an in-depth analysis detailing your home's value as well as a comparison with similar homes in the area
Home Values in the Area
Average Home Value in this Area
Purchase History
| Date | Buyer | Sale Price | Title Company |
|---|---|---|---|
| Karski Anna M | -- | -- | |
| Karski Mark A | $167,500 | -- | |
| Moran Michael J | $85,000 | -- |
Source: Public Records
Mortgage History
| Date | Status | Borrower | Loan Amount |
|---|---|---|---|
| Open | Karski Anna M | $201,000 | |
| Previous Owner | Moran Michael J | $206,250 | |
| Previous Owner | Moran Michael J | $220,000 | |
| Previous Owner | Moran Michael J | $180,000 |
Source: Public Records
Tax History
| Year | Tax Paid | Tax Assessment Tax Assessment Total Assessment is a certain percentage of the fair market value that is determined by local assessors to be the total taxable value of land and additions on the property. | Land | Improvement |
|---|---|---|---|---|
| 2025 | $4,260 | $380,400 | $189,700 | $190,700 |
| 2024 | $4,216 | $361,900 | $184,100 | $177,800 |
| 2023 | $4,068 | $334,300 | $166,300 | $168,000 |
| 2022 | $3,933 | $313,600 | $154,400 | $159,200 |
| 2021 | $3,725 | $293,800 | $136,600 | $157,200 |
| 2020 | $3,688 | $287,700 | $136,600 | $151,100 |
| 2019 | $3,349 | $256,600 | $130,700 | $125,900 |
| 2018 | $3,238 | $241,300 | $130,700 | $110,600 |
| 2017 | $3,017 | $219,900 | $118,800 | $101,100 |
| 2016 | $2,964 | $219,900 | $118,800 | $101,100 |
| 2015 | $2,941 | $211,000 | $109,900 | $101,100 |
| 2014 | $2,835 | $204,400 | $109,900 | $94,500 |
Source: Public Records
Map
Nearby Homes
Your Personal Tour Guide
Ask me questions while you tour the home.