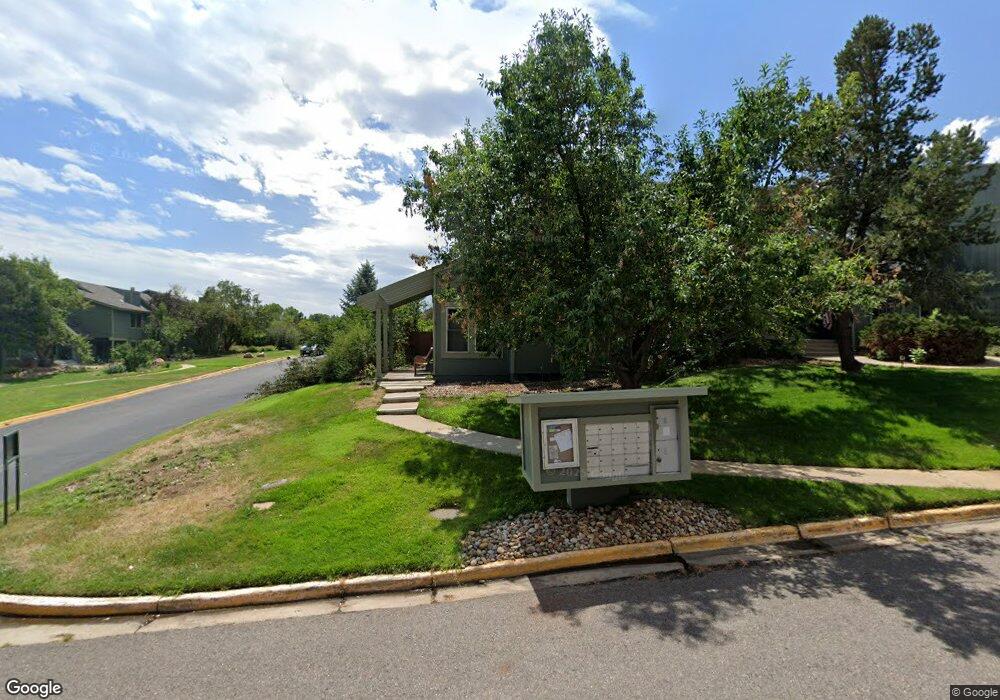
47 Benthaven Place Unit 7 Boulder, CO 80305
Table Mesa NeighborhoodEstimated Value: $844,000 - $878,000
3
Beds
2
Baths
1,515
Sq Ft
$571/Sq Ft
Est. Value
About This Home
This home is located at 47 Benthaven Place Unit 7, Boulder, CO 80305 and is currently estimated at $864,915, approximately $570 per square foot. 47 Benthaven Place Unit 7 is a home located in Boulder County with nearby schools including Mesa Elementary School, Southern Hills Middle School, and Fairview High School.
Ownership History
Date
Name
Owned For
Owner Type
Purchase Details
Closed on
Apr 17, 2025
Sold by
Mills Claudia J
Bought by
Claudia Mills Revocable Trust
Current Estimated Value
Purchase Details
Closed on
Nov 8, 2007
Sold by
Frontczak Mary T
Bought by
Mills Claudia J
Home Financials for this Owner
Home Financials are based on the most recent Mortgage that was taken out on this home.
Original Mortgage
$315,000
Interest Rate
6.42%
Mortgage Type
Purchase Money Mortgage
Purchase Details
Closed on
Jul 18, 2006
Sold by
Myers Elise W
Bought by
Frontczak Mary T
Purchase Details
Closed on
Oct 9, 1992
Bought by
Mills Claudia J
Purchase Details
Closed on
Apr 19, 1988
Bought by
Mills Claudia J
Purchase Details
Closed on
Oct 16, 1978
Bought by
Mills Claudia J
Purchase Details
Closed on
Apr 24, 1973
Bought by
Mills Claudia J
Create a Home Valuation Report for This Property
The Home Valuation Report is an in-depth analysis detailing your home's value as well as a comparison with similar homes in the area
Home Values in the Area
Average Home Value in this Area
Purchase History
| Date | Buyer | Sale Price | Title Company |
|---|---|---|---|
| Claudia Mills Revocable Trust | -- | None Listed On Document | |
| Mills Claudia J | $410,000 | Utc Colorado | |
| Frontczak Mary T | $380,000 | First Colorado Title | |
| Mills Claudia J | -- | -- | |
| Mills Claudia J | $95,000 | -- | |
| Mills Claudia J | $70,600 | -- | |
| Mills Claudia J | $34,800 | -- |
Source: Public Records
Mortgage History
| Date | Status | Borrower | Loan Amount |
|---|---|---|---|
| Previous Owner | Mills Claudia J | $315,000 |
Source: Public Records
Tax History
| Year | Tax Paid | Tax Assessment Tax Assessment Total Assessment is a certain percentage of the fair market value that is determined by local assessors to be the total taxable value of land and additions on the property. | Land | Improvement |
|---|---|---|---|---|
| 2025 | $4,642 | $57,744 | $33,913 | $23,831 |
| 2024 | $4,642 | $57,744 | $33,913 | $23,831 |
| 2023 | $4,562 | $59,523 | $38,940 | $24,267 |
| 2022 | $4,274 | $52,973 | $30,038 | $22,935 |
| 2021 | $4,075 | $54,497 | $30,902 | $23,595 |
| 2020 | $3,620 | $48,734 | $29,887 | $18,847 |
| 2019 | $4,177 | $48,734 | $29,887 | $18,847 |
| 2018 | $3,986 | $45,972 | $29,088 | $16,884 |
| 2017 | $3,861 | $50,824 | $32,158 | $18,666 |
| 2016 | $3,483 | $40,230 | $25,870 | $14,360 |
| 2015 | $3,298 | $34,563 | $14,408 | $20,155 |
| 2014 | $2,906 | $34,563 | $14,408 | $20,155 |
Source: Public Records
Map
Nearby Homes
- 2610 Iliff St
- 2665 Juilliard St
- 2596 Briarwood Dr
- 3210 Emerson Ave
- 2860 Table Mesa Dr
- 3450 Emerson Ave
- 3490 Emerson Ave
- 3590 Endicott Dr
- 3130 Kittrell Ct
- 3394 Cripple Creek Trail Unit 15-H
- 3391 Cripple Creek Trail Unit E
- 623 Hartford Dr
- 3755 Silver Plume Ln
- 2235 Vassar Dr
- 3970 Longwood Ave
- 2795 Vassar Dr
- 3760 Smuggler Place
- 4100 Greenbriar Blvd
- 2955 Stanford Ave
- 2585 Kohler Dr
- 48 Benthaven Place
- 49 Benthaven Place
- 50 Benthaven Place
- 51 Benthaven Place
- 52 Benthaven Place
- 25 Benthaven Place
- 53 Benthaven Place
- 26 Benthaven Place
- 27 Benthaven Place
- 28 Benthaven Place
- 33 Benthaven Place
- 29 Benthaven Place
- 54 Benthaven Place
- 30 Benthaven Place
- 62 Benthaven Place
- 35 Benthaven Place
- 61 Benthaven Place
- 60 Benthaven Place
- 36 Benthaven Place
- 32 Benthaven Place
Your Personal Tour Guide
Ask me questions while you tour the home.