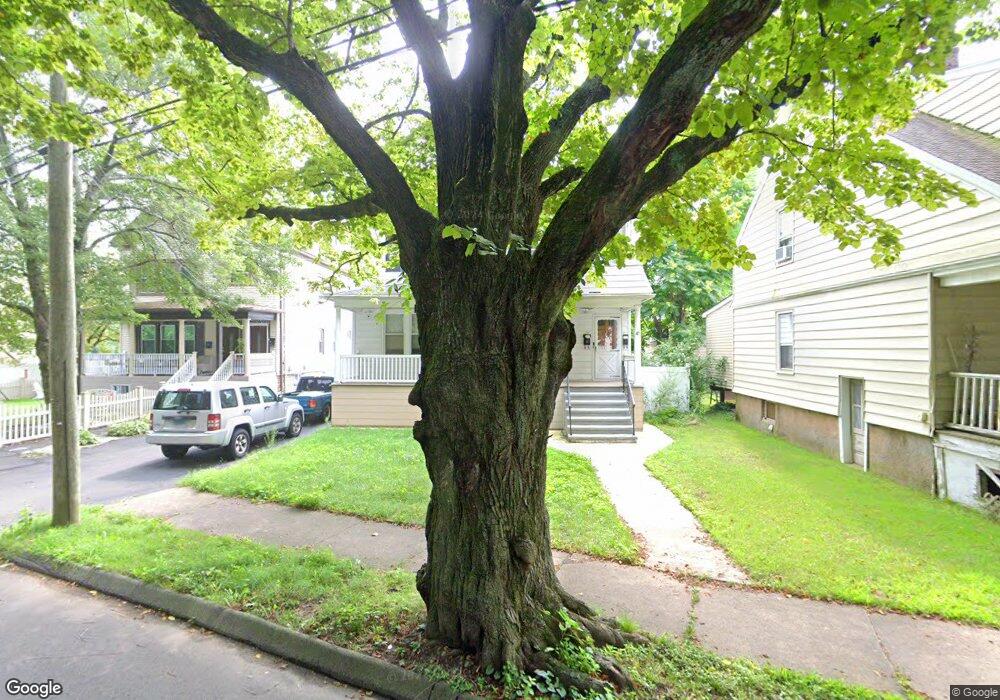
47 Burwell St New Haven, CT 06513
Fair Haven Heights NeighborhoodEstimated Value: $327,420 - $505,000
4
Beds
2
Baths
2,436
Sq Ft
$156/Sq Ft
Est. Value
About This Home
This home is located at 47 Burwell St, New Haven, CT 06513 and is currently estimated at $380,105, approximately $156 per square foot. 47 Burwell St is a home located in New Haven County with nearby schools including Ross Woodward, Cold Spring School, and St Francis & St Rose Of Lima School.
Ownership History
Date
Name
Owned For
Owner Type
Purchase Details
Closed on
Jul 7, 2017
Sold by
Logioco John W and Logioco Marie R
Bought by
Sabatino-Herrera Jose A
Current Estimated Value
Home Financials for this Owner
Home Financials are based on the most recent Mortgage that was taken out on this home.
Original Mortgage
$142,373
Outstanding Balance
$121,337
Interest Rate
4.87%
Mortgage Type
FHA
Estimated Equity
$258,768
Create a Home Valuation Report for This Property
The Home Valuation Report is an in-depth analysis detailing your home's value as well as a comparison with similar homes in the area
Home Values in the Area
Average Home Value in this Area
Purchase History
| Date | Buyer | Sale Price | Title Company |
|---|---|---|---|
| Sabatino-Herrera Jose A | $145,000 | -- |
Source: Public Records
Mortgage History
| Date | Status | Borrower | Loan Amount |
|---|---|---|---|
| Open | Sabatino-Herrera Jose A | $142,373 |
Source: Public Records
Tax History Compared to Growth
Tax History
| Year | Tax Paid | Tax Assessment Tax Assessment Total Assessment is a certain percentage of the fair market value that is determined by local assessors to be the total taxable value of land and additions on the property. | Land | Improvement |
|---|---|---|---|---|
| 2025 | $6,928 | $175,840 | $40,600 | $135,240 |
| 2024 | $6,770 | $175,840 | $40,600 | $135,240 |
| 2023 | $6,541 | $175,840 | $40,600 | $135,240 |
| 2022 | $6,990 | $175,840 | $40,600 | $135,240 |
| 2021 | $5,142 | $117,180 | $26,600 | $90,580 |
| 2020 | $5,142 | $117,180 | $26,600 | $90,580 |
| 2019 | $5,036 | $117,180 | $26,600 | $90,580 |
| 2018 | $5,036 | $117,180 | $26,600 | $90,580 |
| 2017 | $4,533 | $117,180 | $26,600 | $90,580 |
| 2016 | $4,197 | $101,010 | $25,130 | $75,880 |
| 2015 | $4,197 | $101,010 | $25,130 | $75,880 |
| 2014 | $4,197 | $101,010 | $25,130 | $75,880 |
Source: Public Records
Map
Nearby Homes
- 45 Quinnipiac Ave Unit 45
- 51 Quinnipiac Ave Unit 51
- 20 Ashland Place
- 37 Fairmont Ave
- 98 Quinnipiac Ave
- 74 Milton St
- 28 Farren Ave
- 30 Chamberlain Place
- 172 Quinnipiac Ave
- 1117 Townsend Ave
- 225 Fulton Terrace
- 138 Beacon Ave
- 30 Warwick St
- 103 Hillside Ave
- 232 Elaine Terrace
- 104 Terrace St
- 1030 Townsend Ave
- 186 Farren Ave
- 190 Farren Ave
- 193 Farren Ave