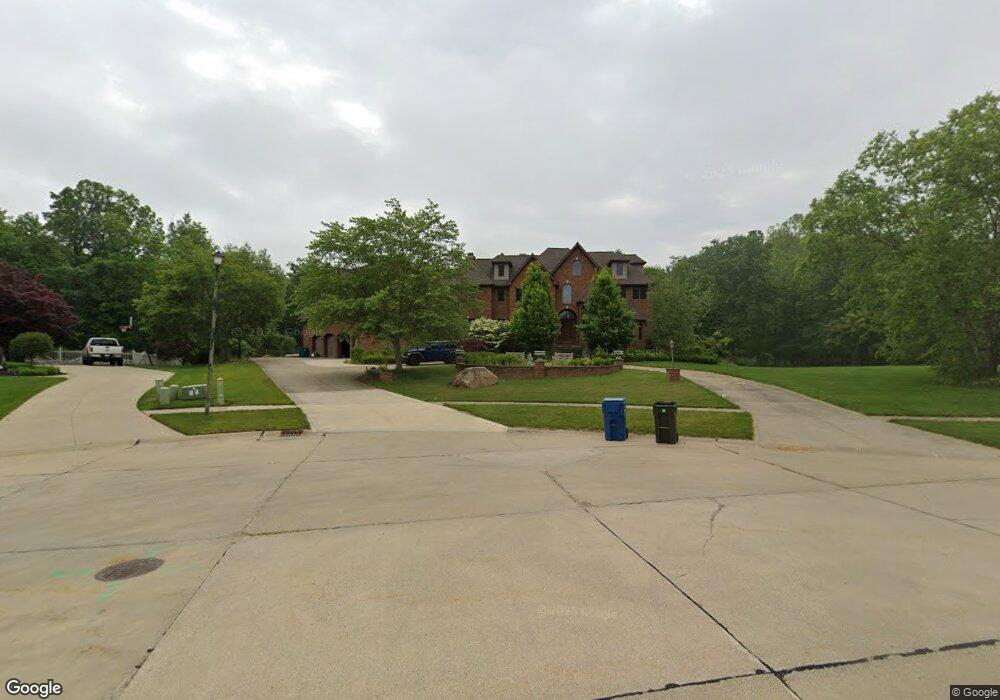
47 Canterbury Cir Amherst, OH 44001
Estimated Value: $1,344,318 - $2,052,000
6
Beds
8
Baths
9,807
Sq Ft
$173/Sq Ft
Est. Value
About This Home
This home is located at 47 Canterbury Cir, Amherst, OH 44001 and is currently estimated at $1,698,159, approximately $173 per square foot. 47 Canterbury Cir is a home located in Lorain County with nearby schools including Powers Elementary School, Walter G. Nord Middle School, and Amherst Junior High School.
Ownership History
Date
Name
Owned For
Owner Type
Purchase Details
Closed on
Feb 21, 2018
Sold by
Roach Mary and Roach Mark J
Bought by
Roach Mark J
Current Estimated Value
Home Financials for this Owner
Home Financials are based on the most recent Mortgage that was taken out on this home.
Original Mortgage
$1,018,500
Outstanding Balance
$866,017
Interest Rate
4.15%
Mortgage Type
New Conventional
Estimated Equity
$832,142
Purchase Details
Closed on
Mar 26, 2007
Sold by
Docherty Thomas C and Docherty Jane E
Bought by
Roach Mark J and Roach Mary
Home Financials for this Owner
Home Financials are based on the most recent Mortgage that was taken out on this home.
Original Mortgage
$1,200,000
Interest Rate
6.31%
Mortgage Type
Purchase Money Mortgage
Create a Home Valuation Report for This Property
The Home Valuation Report is an in-depth analysis detailing your home's value as well as a comparison with similar homes in the area
Home Values in the Area
Average Home Value in this Area
Purchase History
| Date | Buyer | Sale Price | Title Company |
|---|---|---|---|
| Roach Mark J | -- | -- | |
| Roach Mark J | $1,600,000 | City Title Company |
Source: Public Records
Mortgage History
| Date | Status | Borrower | Loan Amount |
|---|---|---|---|
| Open | Roach Mark J | $1,018,500 | |
| Closed | Roach Mark J | $1,200,000 |
Source: Public Records
Tax History Compared to Growth
Tax History
| Year | Tax Paid | Tax Assessment Tax Assessment Total Assessment is a certain percentage of the fair market value that is determined by local assessors to be the total taxable value of land and additions on the property. | Land | Improvement |
|---|---|---|---|---|
| 2024 | $34,122 | $844,484 | $34,265 | $810,219 |
| 2023 | $27,908 | $581,592 | $49,567 | $532,025 |
| 2022 | $26,757 | $581,592 | $49,567 | $532,025 |
| 2021 | $26,800 | $581,592 | $49,567 | $532,025 |
| 2020 | $28,780 | $554,430 | $47,250 | $507,180 |
| 2019 | $28,205 | $554,430 | $47,250 | $507,180 |
| 2018 | $28,351 | $554,430 | $47,250 | $507,180 |
| 2017 | $21,294 | $390,780 | $28,670 | $362,110 |
| 2016 | $18,644 | $339,550 | $28,670 | $310,880 |
| 2015 | $18,540 | $339,550 | $28,670 | $310,880 |
| 2014 | $19,443 | $354,440 | $29,930 | $324,510 |
| 2013 | $19,699 | $357,920 | $29,930 | $327,990 |
Source: Public Records
Map
Nearby Homes
- 621 Van Oaks Dr
- 335 Copper Creek
- 748 Tarry Ln
- 133 Ambleside Way
- 658 Nicole Dr
- 281 English Lakes Blvd Unit 67281
- 814 Valley Dr
- 0 Stonebridge Dr
- 2176 Myla Way
- 2180 Myla Way
- 8030 Pyle South Amherst Rd
- V/L Middle Ridge Rd
- 394 Long St
- 292 Westwoods
- 302 Westwoods
- 311 Oak St Unit 311
- 7055 Quarry Rd Unit 440
- 7055 Quarry Rd Unit 43
- 7055 Quarry Rd Unit 95
- 7055 Quarry Rd Unit 33
- 31 Canterbury Cir Unit 31
- 49 Canterbury Cir
- 45 Canterbury Cir
- 41 Canterbury Cir
- 51 Canterbury Cir
- 40 Canterbury Cir
- 53 Canterbury Cir
- 0 Canterbury Cir
- 50 Canterbury Cir
- 42 Canterbury Cir
- 55 Canterbury Cir
- 39 Stonehedge Way
- 54 Canterbury Cir
- 61 Beech Cliff Dr
- 57 Canterbury Cir
- 878 S Main St
- 63 Beech Cliff Dr
- 56 Canterbury Cir
- 56 Canterbury Cir
- 475 Kar A Bru Dr