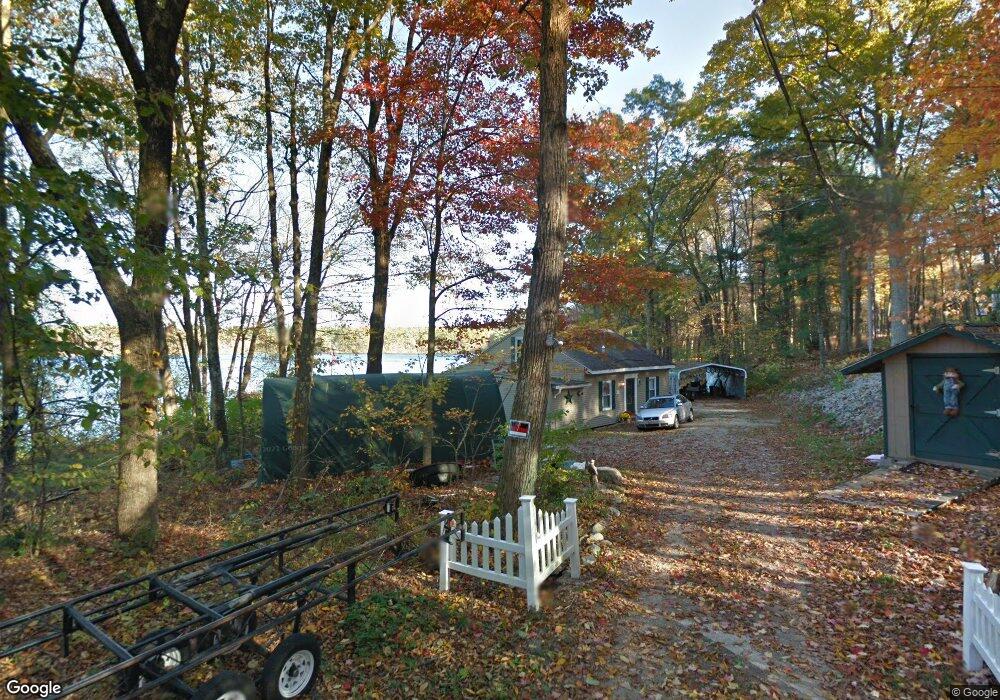
47 Carrier Ln Sutton, MA 01590
Estimated Value: $603,000 - $854,000
2
Beds
3
Baths
2,304
Sq Ft
$331/Sq Ft
Est. Value
About This Home
This home is located at 47 Carrier Ln, Sutton, MA 01590 and is currently estimated at $762,994, approximately $331 per square foot. 47 Carrier Ln is a home located in Worcester County with nearby schools including Sutton Elementary School, Sutton Middle School, and Sutton High School.
Ownership History
Date
Name
Owned For
Owner Type
Purchase Details
Closed on
Sep 18, 2019
Sold by
Britt Timothy J and Britt Maureen
Bought by
Britt Maureen
Current Estimated Value
Purchase Details
Closed on
Jul 23, 2010
Sold by
Britt Eleanor M and Britt Timothy H
Bought by
Britt Timothy J and Britt Maureen
Purchase Details
Closed on
Aug 17, 2000
Sold by
Smith Harold A and Smith Shirley A
Bought by
Britt Eleanor M and Britt Timothy H
Create a Home Valuation Report for This Property
The Home Valuation Report is an in-depth analysis detailing your home's value as well as a comparison with similar homes in the area
Home Values in the Area
Average Home Value in this Area
Purchase History
| Date | Buyer | Sale Price | Title Company |
|---|---|---|---|
| Britt Maureen | -- | -- | |
| Britt Timothy J | -- | -- | |
| Britt Eleanor M | $78,000 | -- |
Source: Public Records
Tax History
| Year | Tax Paid | Tax Assessment Tax Assessment Total Assessment is a certain percentage of the fair market value that is determined by local assessors to be the total taxable value of land and additions on the property. | Land | Improvement |
|---|---|---|---|---|
| 2025 | $8,520 | $708,800 | $240,700 | $468,100 |
| 2024 | $8,661 | $683,018 | $230,618 | $452,400 |
| 2023 | $9,041 | $652,800 | $208,600 | $444,200 |
| 2022 | $7,930 | $522,400 | $166,500 | $355,900 |
| 2021 | $8,189 | $511,800 | $166,500 | $345,300 |
| 2020 | $7,783 | $490,700 | $166,500 | $324,200 |
| 2019 | $4,958 | $300,100 | $217,900 | $82,200 |
| 2018 | $4,343 | $262,400 | $185,200 | $77,200 |
| 2017 | $3,995 | $242,100 | $162,900 | $79,200 |
| 2016 | $3,988 | $239,100 | $162,900 | $76,200 |
| 2015 | $3,921 | $235,100 | $162,900 | $72,200 |
| 2014 | $3,449 | $204,300 | $138,700 | $65,600 |
Source: Public Records
Map
Nearby Homes
- 19 Birch St
- 4 1st St
- 108 Mumford St
- 18 Lakeshore Dr
- 266 Putnam Hill Rd
- 36 Compass Point Dr Unit 36
- 24 Manchaug Rd
- 26 Compass Point Dr Unit 26
- 33 Nautical Way Unit 107
- Lot 27 Cedar St
- 60 Webster St
- 109 Mendon Rd
- 22 Gilboa St
- 8 Hough Rd
- 5 B St
- 3 S East Main St
- 80 Barnett Rd
- 408 NE Main St
- 198 Uxbridge Rd
- 2 White Ct
Your Personal Tour Guide
Ask me questions while you tour the home.