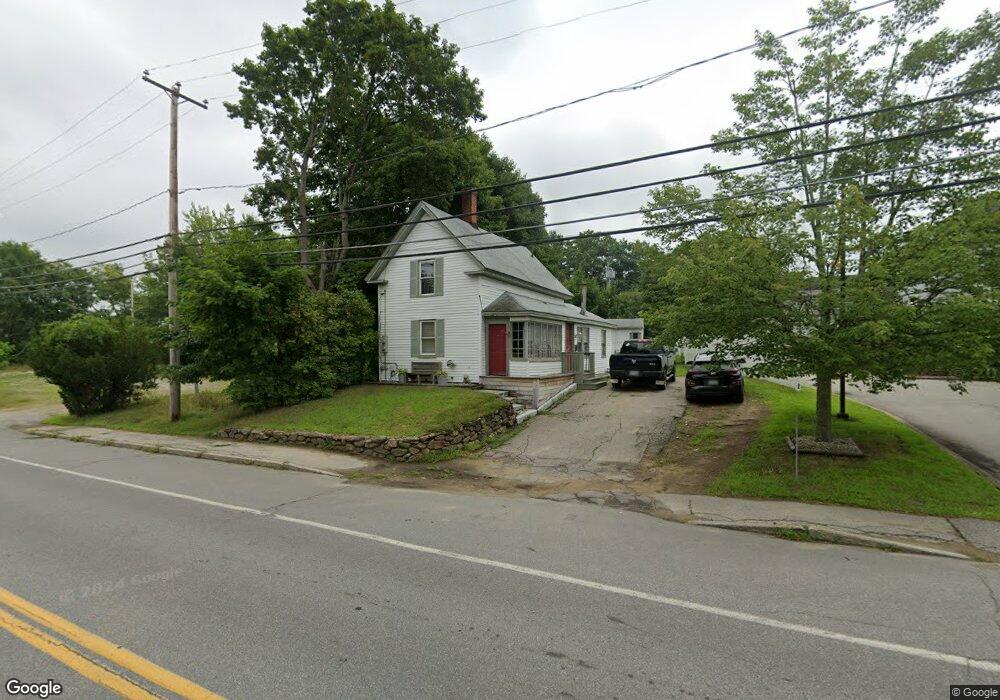
47 Carroll St Pittsfield, NH 03263
Estimated Value: $322,415 - $342,000
3
Beds
2
Baths
1,800
Sq Ft
$185/Sq Ft
Est. Value
About This Home
This home is located at 47 Carroll St, Pittsfield, NH 03263 and is currently estimated at $333,604, approximately $185 per square foot. 47 Carroll St is a home located in Merrimack County with nearby schools including Pittsfield Elementary School and Pittsfield High School.
Ownership History
Date
Name
Owned For
Owner Type
Purchase Details
Closed on
Sep 7, 2010
Sold by
3 Bears Llc
Bought by
Asdot Sean C and Asdot Heidi A
Current Estimated Value
Home Financials for this Owner
Home Financials are based on the most recent Mortgage that was taken out on this home.
Original Mortgage
$137,053
Outstanding Balance
$91,004
Interest Rate
4.55%
Mortgage Type
Purchase Money Mortgage
Estimated Equity
$242,600
Purchase Details
Closed on
Feb 2, 2007
Sold by
Jalbert Brian J
Bought by
Structured Asset Inv L
Purchase Details
Closed on
Jul 5, 2005
Sold by
Butler Enterprises Llc
Bought by
Jalbert Brian J
Home Financials for this Owner
Home Financials are based on the most recent Mortgage that was taken out on this home.
Original Mortgage
$105,596
Interest Rate
9%
Mortgage Type
Adjustable Rate Mortgage/ARM
Purchase Details
Closed on
Apr 19, 2005
Sold by
Smith Vincent R and Smith Donna M
Bought by
Butler Enterprises Pro
Create a Home Valuation Report for This Property
The Home Valuation Report is an in-depth analysis detailing your home's value as well as a comparison with similar homes in the area
Home Values in the Area
Average Home Value in this Area
Purchase History
| Date | Buyer | Sale Price | Title Company |
|---|---|---|---|
| Asdot Sean C | $138,900 | -- | |
| Structured Asset Inv L | $118,400 | -- | |
| Jalbert Brian J | $132,000 | -- | |
| Jalbert Brian J | $132,000 | -- | |
| Butler Enterprises Pro | $63,000 | -- |
Source: Public Records
Mortgage History
| Date | Status | Borrower | Loan Amount |
|---|---|---|---|
| Open | Butler Enterprises Pro | $137,053 | |
| Previous Owner | Jalbert Brian J | $105,596 |
Source: Public Records
Tax History Compared to Growth
Tax History
| Year | Tax Paid | Tax Assessment Tax Assessment Total Assessment is a certain percentage of the fair market value that is determined by local assessors to be the total taxable value of land and additions on the property. | Land | Improvement |
|---|---|---|---|---|
| 2024 | $4,758 | $159,300 | $46,000 | $113,300 |
| 2023 | $3,978 | $159,300 | $46,000 | $113,300 |
| 2022 | $3,788 | $159,300 | $46,000 | $113,300 |
| 2020 | $3,938 | $159,300 | $46,000 | $113,300 |
| 2019 | $3,493 | $106,300 | $15,500 | $90,800 |
| 2018 | $3,545 | $106,300 | $15,500 | $90,800 |
| 2017 | $3,557 | $106,300 | $15,500 | $90,800 |
| 2016 | $3,428 | $106,300 | $15,500 | $90,800 |
| 2015 | $3,170 | $104,700 | $15,500 | $89,200 |
| 2014 | $4,061 | $139,400 | $34,300 | $105,100 |
| 2013 | $4,254 | $138,200 | $34,300 | $103,900 |
Source: Public Records
Map
Nearby Homes
- 7 Cram Ave
- 4 Berry Ave
- 110 Main St
- 21 Concord Hill Rd
- 23 Concord Hill Rd
- 81 Winant Rd
- 9 Shackford Ct
- 93 Fairview Dr
- 99 Fairview Dr
- 449 Tilton Hill Rd
- 1310 & 1311 Upper City Rd
- 127 Kaime Rd
- L33 Province Rd
- 0 Shaw Rd Unit 36-1
- 28 Sanderson Dr
- 47 Daroska Rd
- 268 Mountain Rd
- M2-l29-2 Province Rd
- 371 Province Rd
- 116 Webster Mills Rd
- 8 Catamount Rd
- 10 Catamount Rd
- 40 Carroll St
- 44 Carroll St
- 2 Tilton Hill Rd
- Lot R7-2-3 Tilton Hill Rd
- 2 Tilton Hill Rd
- 6 Tilton Hill Rd
- 38 Carroll St
- 42 Carroll St
- 5 Tilton Hill Rd
- 1 Tilton Hill Rd
- 1 Tilton Hill Rd
- 15 Catamount Rd
- 14 Tilton Hill Rd
- 1 Tilton Hill Rd
- 1 Manchester St
- 24 Catamount Rd
- 5 Broadway St
- 5 Fayette St