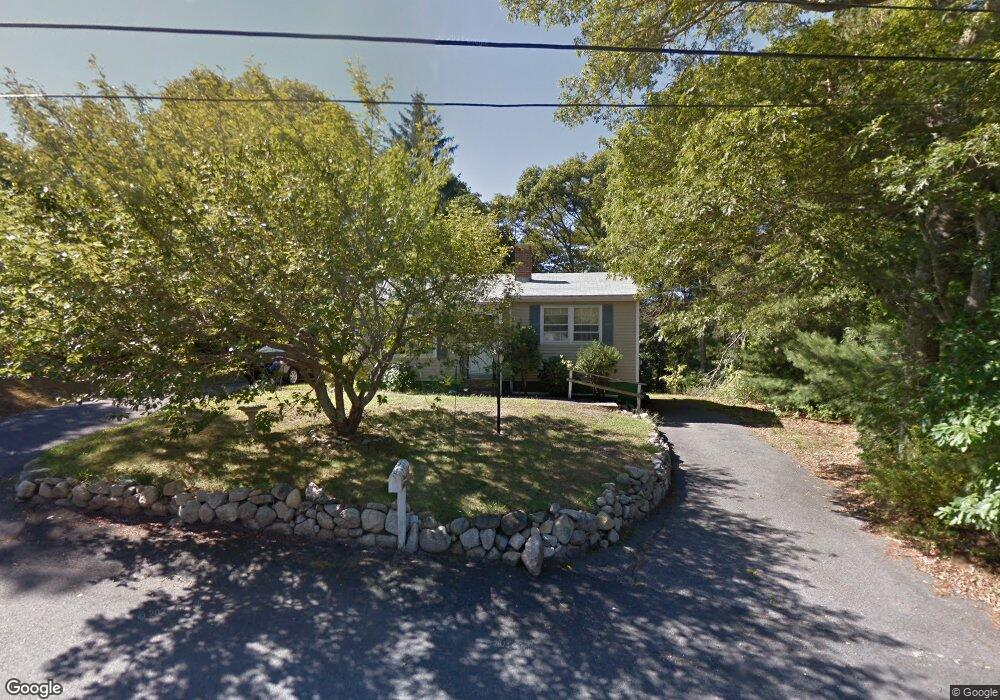
47 Cliff Rd Bourne, MA 2532
Monument Beach NeighborhoodEstimated Value: $435,000 - $532,000
2
Beds
1
Bath
792
Sq Ft
$600/Sq Ft
Est. Value
About This Home
This home is located at 47 Cliff Rd, Bourne, MA 2532 and is currently estimated at $475,366, approximately $600 per square foot. 47 Cliff Rd is a home located in Barnstable County with nearby schools including Bourne High School, Cadence Academy Preschool - Bourne, and St Margaret Regional School.
Ownership History
Date
Name
Owned For
Owner Type
Purchase Details
Closed on
Jun 25, 2008
Sold by
Johnson Kenneth H
Bought by
Kenneth H Johnson T H and Kenneth Johnson
Current Estimated Value
Purchase Details
Closed on
Oct 28, 1999
Sold by
Rattray Bessie G
Bought by
Johnson Kenneth H
Home Financials for this Owner
Home Financials are based on the most recent Mortgage that was taken out on this home.
Original Mortgage
$87,900
Interest Rate
7.78%
Mortgage Type
Purchase Money Mortgage
Create a Home Valuation Report for This Property
The Home Valuation Report is an in-depth analysis detailing your home's value as well as a comparison with similar homes in the area
Home Values in the Area
Average Home Value in this Area
Purchase History
| Date | Buyer | Sale Price | Title Company |
|---|---|---|---|
| Kenneth H Johnson T H | -- | -- | |
| Kenneth H Johnson T H | -- | -- | |
| Johnson Kenneth H | $109,900 | -- | |
| Johnson Kenneth H | $109,900 | -- |
Source: Public Records
Mortgage History
| Date | Status | Borrower | Loan Amount |
|---|---|---|---|
| Previous Owner | Johnson Kenneth H | $87,900 |
Source: Public Records
Tax History
| Year | Tax Paid | Tax Assessment Tax Assessment Total Assessment is a certain percentage of the fair market value that is determined by local assessors to be the total taxable value of land and additions on the property. | Land | Improvement |
|---|---|---|---|---|
| 2025 | $2,862 | $366,400 | $194,300 | $172,100 |
| 2024 | $2,798 | $348,900 | $185,000 | $163,900 |
| 2023 | $2,720 | $308,700 | $163,700 | $145,000 |
| 2022 | $2,623 | $260,000 | $144,900 | $115,100 |
| 2021 | $2,549 | $236,700 | $131,900 | $104,800 |
| 2020 | $2,468 | $229,800 | $130,600 | $99,200 |
| 2019 | $2,370 | $225,500 | $130,600 | $94,900 |
| 2018 | $2,213 | $210,000 | $124,400 | $85,600 |
| 2017 | $2,080 | $201,900 | $117,100 | $84,800 |
| 2016 | $2,011 | $197,900 | $117,100 | $80,800 |
| 2015 | $1,869 | $185,600 | $104,800 | $80,800 |
Source: Public Records
Map
Nearby Homes
- 566 Shore Rd
- 203 County Rd
- 16 Amberwood Ct
- 4 Harbor Hill Dr
- 20 Colony Ave
- 12 Turnberry Rd Unit 12
- 13 Laurel Hill Ct
- 5 Sea Knoll Ct
- 4 Hollyhock Knoll Ct Unit 4
- 4 Hollyhock Knoll Ct Unit 4
- 5 Zoli Ln
- 35 Benedict Rd
- 14 Navajo Rd
- 709 County Rd
- 3 1st St
- 254 Barlows Landing Rd
- 44 Cotuit Rd
- 3 4th Ave
- 7 4th Ave
- 16 Michael Rd
Your Personal Tour Guide
Ask me questions while you tour the home.