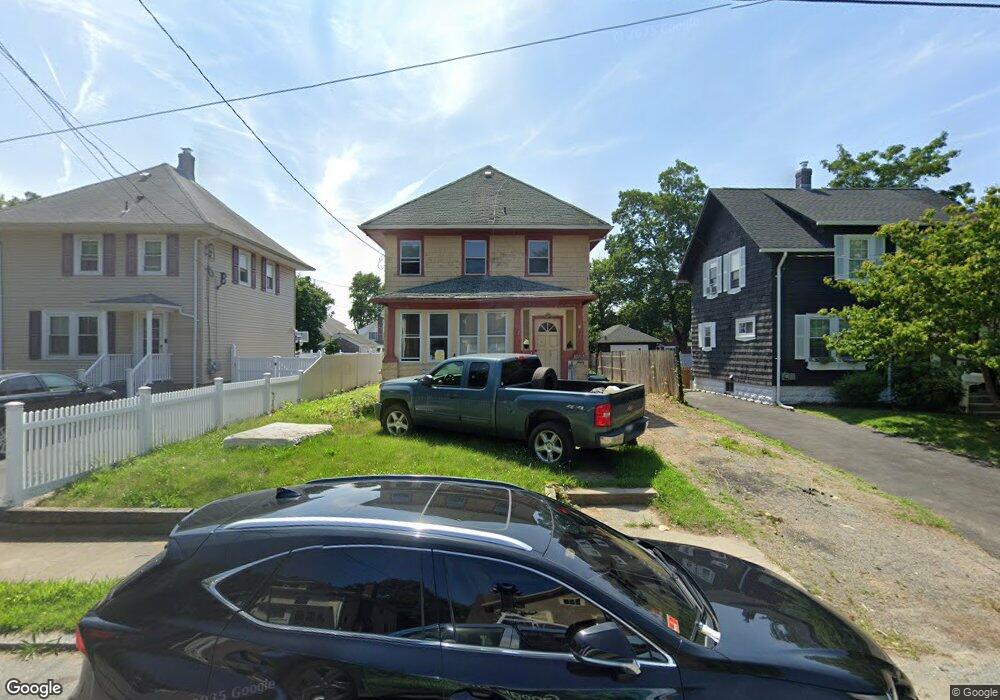
47 Denver Ave Cranston, RI 02905
Edgewood NeighborhoodEstimated Value: $188,000 - $399,214
3
Beds
1
Bath
1,144
Sq Ft
$247/Sq Ft
Est. Value
About This Home
This home is located at 47 Denver Ave, Cranston, RI 02905 and is currently estimated at $282,054, approximately $246 per square foot. 47 Denver Ave is a home located in Providence County with nearby schools including Edgewood Highland Elementary School, Edward S. Rhodes School, and Park View Middle School.
Ownership History
Date
Name
Owned For
Owner Type
Purchase Details
Closed on
May 22, 2025
Sold by
Moss Home Solutions Llc
Bought by
Canalda Josuel
Current Estimated Value
Home Financials for this Owner
Home Financials are based on the most recent Mortgage that was taken out on this home.
Original Mortgage
$335,000
Outstanding Balance
$333,200
Interest Rate
6.62%
Mortgage Type
Commercial
Estimated Equity
-$51,146
Purchase Details
Closed on
Jan 10, 1995
Sold by
Ponto Joseph A and Ponto Carole
Bought by
Watkins William E
Purchase Details
Closed on
Jul 27, 1988
Sold by
Safford Charles
Bought by
Ponto Joseph
Create a Home Valuation Report for This Property
The Home Valuation Report is an in-depth analysis detailing your home's value as well as a comparison with similar homes in the area
Home Values in the Area
Average Home Value in this Area
Purchase History
| Date | Buyer | Sale Price | Title Company |
|---|---|---|---|
| Canalda Josuel | $265,000 | None Available | |
| Canalda Josuel | $265,000 | None Available | |
| Moss Home Solutions Llc | $150,000 | None Available | |
| Moss Home Solutions Llc | $150,000 | None Available | |
| Watkins William E | $85,000 | -- | |
| Watkins William E | $85,000 | -- | |
| Ponto Joseph | $104,000 | -- | |
| Ponto Joseph | $104,000 | -- |
Source: Public Records
Mortgage History
| Date | Status | Borrower | Loan Amount |
|---|---|---|---|
| Open | Canalda Josuel | $335,000 | |
| Closed | Canalda Josuel | $335,000 | |
| Previous Owner | Ponto Joseph | $108,000 | |
| Previous Owner | Ponto Joseph | $130,000 | |
| Previous Owner | Ponto Joseph | $80,000 |
Source: Public Records
Tax History Compared to Growth
Tax History
| Year | Tax Paid | Tax Assessment Tax Assessment Total Assessment is a certain percentage of the fair market value that is determined by local assessors to be the total taxable value of land and additions on the property. | Land | Improvement |
|---|---|---|---|---|
| 2025 | $3,781 | $272,400 | $106,200 | $166,200 |
| 2024 | $3,707 | $272,400 | $106,200 | $166,200 |
| 2023 | $3,769 | $199,400 | $69,900 | $129,500 |
| 2022 | $3,691 | $199,400 | $69,900 | $129,500 |
| 2021 | $3,589 | $199,400 | $69,900 | $129,500 |
| 2020 | $3,533 | $170,100 | $66,600 | $103,500 |
| 2019 | $3,533 | $170,100 | $66,600 | $103,500 |
| 2018 | $3,451 | $170,100 | $66,600 | $103,500 |
| 2017 | $3,308 | $144,200 | $59,900 | $84,300 |
| 2016 | $3,237 | $144,200 | $59,900 | $84,300 |
| 2015 | $3,237 | $144,200 | $59,900 | $84,300 |
| 2014 | $3,211 | $140,600 | $59,900 | $80,700 |
Source: Public Records
Map
Nearby Homes