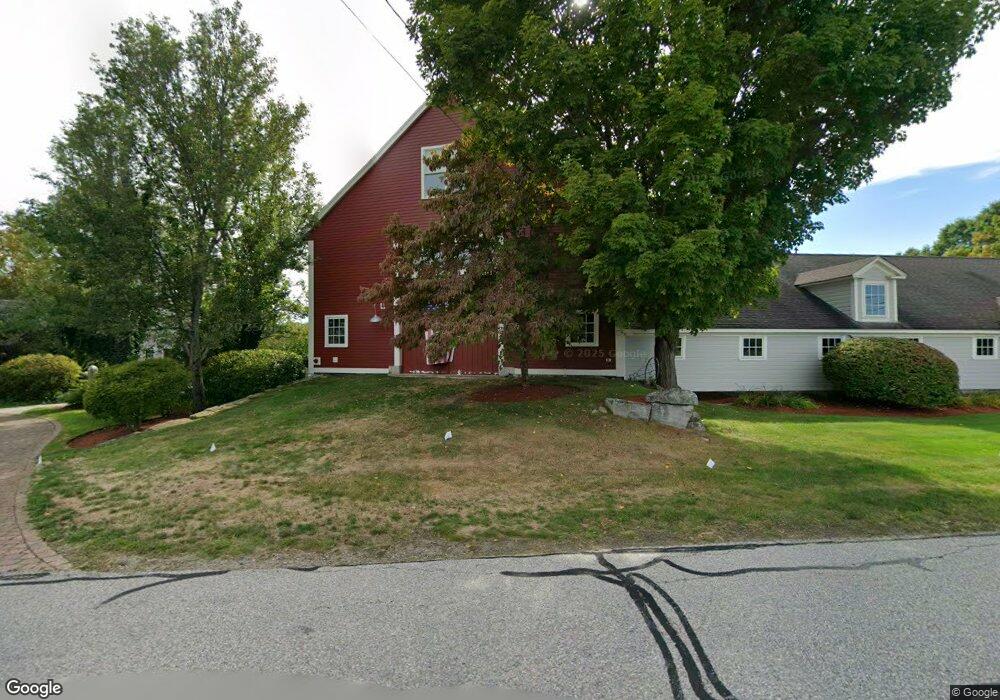
47 Dow Rd Hollis, NH 03049
Hollis NeighborhoodEstimated Value: $1,919,000 - $2,449,750
5
Beds
5
Baths
7,500
Sq Ft
$286/Sq Ft
Est. Value
About This Home
This home is located at 47 Dow Rd, Hollis, NH 03049 and is currently estimated at $2,147,583, approximately $286 per square foot. 47 Dow Rd is a home located in Hillsborough County with nearby schools including Hollis Primary School, Hollis Upper Elementary School, and Hollis-Brookline Middle School.
Ownership History
Date
Name
Owned For
Owner Type
Purchase Details
Closed on
Nov 25, 2014
Sold by
Sarah W Brassard Ret
Bought by
Bethany S Prunier Ret
Current Estimated Value
Purchase Details
Closed on
Oct 7, 2014
Sold by
Brassard David and Brassard Sarah
Bought by
Sarah W Brassard Ret and Brassard
Create a Home Valuation Report for This Property
The Home Valuation Report is an in-depth analysis detailing your home's value as well as a comparison with similar homes in the area
Home Values in the Area
Average Home Value in this Area
Purchase History
| Date | Buyer | Sale Price | Title Company |
|---|---|---|---|
| Bethany S Prunier Ret | $1,000,000 | -- | |
| Bethany S Prunier Ret | $1,000,000 | -- | |
| Sarah W Brassard Ret | -- | -- | |
| Sarah W Brassard Ret | -- | -- |
Source: Public Records
Mortgage History
| Date | Status | Borrower | Loan Amount |
|---|---|---|---|
| Previous Owner | Sarah W Brassard Ret | $900,000 | |
| Previous Owner | Sarah W Brassard Ret | $830,000 | |
| Closed | Sarah W Brassard Ret | $0 |
Source: Public Records
Tax History Compared to Growth
Tax History
| Year | Tax Paid | Tax Assessment Tax Assessment Total Assessment is a certain percentage of the fair market value that is determined by local assessors to be the total taxable value of land and additions on the property. | Land | Improvement |
|---|---|---|---|---|
| 2024 | $33,715 | $1,901,600 | $380,500 | $1,521,100 |
| 2023 | $31,681 | $1,901,600 | $380,500 | $1,521,100 |
| 2022 | $42,919 | $1,901,600 | $380,500 | $1,521,100 |
| 2021 | $30,000 | $1,321,600 | $246,500 | $1,075,100 |
| 2020 | $30,635 | $1,321,600 | $246,500 | $1,075,100 |
| 2019 | $30,529 | $1,321,600 | $246,500 | $1,075,100 |
| 2018 | $26,580 | $1,226,600 | $246,500 | $980,100 |
| 2017 | $25,125 | $1,085,300 | $211,600 | $873,700 |
| 2016 | $25,429 | $1,085,300 | $211,600 | $873,700 |
| 2015 | $24,984 | $1,085,300 | $211,600 | $873,700 |
| 2014 | $25,103 | $1,085,300 | $211,600 | $873,700 |
| 2013 | $24,767 | $1,085,300 | $211,600 | $873,700 |
Source: Public Records
Map
Nearby Homes