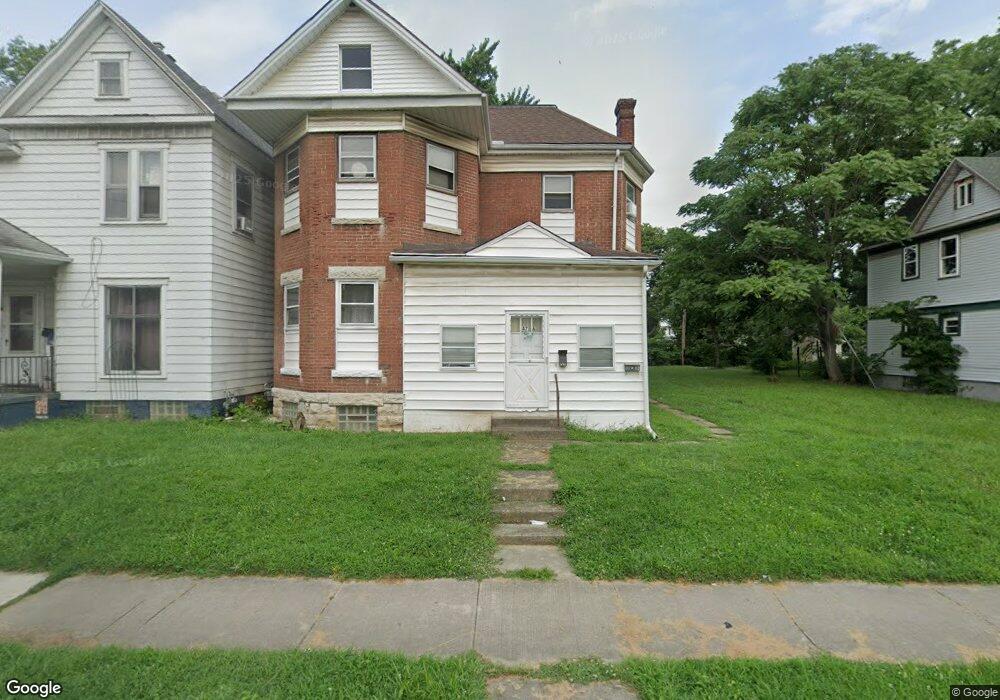
47 E Helena St Dayton, OH 45405
Riverdale NeighborhoodEstimated Value: $72,000 - $119,633
4
Beds
2
Baths
2,408
Sq Ft
$39/Sq Ft
Est. Value
About This Home
This home is located at 47 E Helena St, Dayton, OH 45405 and is currently estimated at $94,908, approximately $39 per square foot. 47 E Helena St is a home located in Montgomery County with nearby schools including Valerie Elementary School, Deca Prep, and Richard Allen Academy.
Ownership History
Date
Name
Owned For
Owner Type
Purchase Details
Closed on
Sep 17, 2021
Sold by
Sidigu Lucy A
Bought by
Phiri Lindiwe and Mukonkole Kazadi
Current Estimated Value
Home Financials for this Owner
Home Financials are based on the most recent Mortgage that was taken out on this home.
Original Mortgage
$43,000
Outstanding Balance
$38,870
Interest Rate
2.8%
Mortgage Type
Seller Take Back
Estimated Equity
$56,038
Purchase Details
Closed on
Apr 29, 2009
Sold by
Indiana Luxury Homes Inc
Bought by
Sidigu Lucy A
Purchase Details
Closed on
Feb 26, 2009
Sold by
Beneficial Mortgage Co Of Ohio
Bought by
Indiana Luxury Homes Inc and Coachs Corner Enterprises Inc
Purchase Details
Closed on
Aug 28, 2008
Sold by
Butler Kenneth W and Butler Donna R
Bought by
Beneficial Mortgage Co Of Ohio
Purchase Details
Closed on
Apr 19, 1994
Sold by
Parker Andrew R and Parker Helen M
Bought by
Butler Kenneth W and Butler Donna R
Create a Home Valuation Report for This Property
The Home Valuation Report is an in-depth analysis detailing your home's value as well as a comparison with similar homes in the area
Home Values in the Area
Average Home Value in this Area
Purchase History
| Date | Buyer | Sale Price | Title Company |
|---|---|---|---|
| Phiri Lindiwe | $50,000 | None Available | |
| Sidigu Lucy A | $8,700 | Attorney | |
| Indiana Luxury Homes Inc | $4,900 | Public Square Title Agency L | |
| Beneficial Mortgage Co Of Ohio | $26,000 | Public Square Title | |
| Butler Kenneth W | -- | -- |
Source: Public Records
Mortgage History
| Date | Status | Borrower | Loan Amount |
|---|---|---|---|
| Open | Phiri Lindiwe | $43,000 |
Source: Public Records
Tax History
| Year | Tax Paid | Tax Assessment Tax Assessment Total Assessment is a certain percentage of the fair market value that is determined by local assessors to be the total taxable value of land and additions on the property. | Land | Improvement |
|---|---|---|---|---|
| 2025 | $1,209 | $19,290 | $4,250 | $15,040 |
| 2024 | $1,136 | $19,290 | $4,250 | $15,040 |
| 2023 | $1,136 | $19,290 | $4,250 | $15,040 |
| 2022 | $1,032 | $13,490 | $2,970 | $10,520 |
| 2021 | $1,027 | $13,490 | $2,970 | $10,520 |
| 2020 | $1,041 | $13,490 | $2,970 | $10,520 |
| 2019 | $978 | $11,290 | $2,970 | $8,320 |
| 2018 | $979 | $11,290 | $2,970 | $8,320 |
| 2017 | $972 | $11,290 | $2,970 | $8,320 |
| 2016 | $1,078 | $12,000 | $2,970 | $9,030 |
| 2015 | $1,022 | $12,000 | $2,970 | $9,030 |
| 2014 | $1,022 | $12,000 | $2,970 | $9,030 |
| 2012 | -- | $16,650 | $3,690 | $12,960 |
Source: Public Records
Map
Nearby Homes
- 35 Vincent St
- 55 Vincent St
- 39 Pioneer St
- 20 5 Oaks Ave
- 62 Pioneer St
- 534 Geyer St
- 44 W Mumma Ave
- 63 E Burton Ave
- 928 Old Orchard Ave
- 334 Geyer St
- 128 Hershey St
- 312 Rockwood Ave
- 42 Lawn St
- 601 Riverside Dr
- 410 5 Oaks Ave
- 615 Grafton Ave
- 226 Mcdaniel St Unit 130
- 226 Mcdaniel St Unit 30
- 226 Mcdaniel St Unit 10
- 127 Iroquois Ave
Your Personal Tour Guide
Ask me questions while you tour the home.