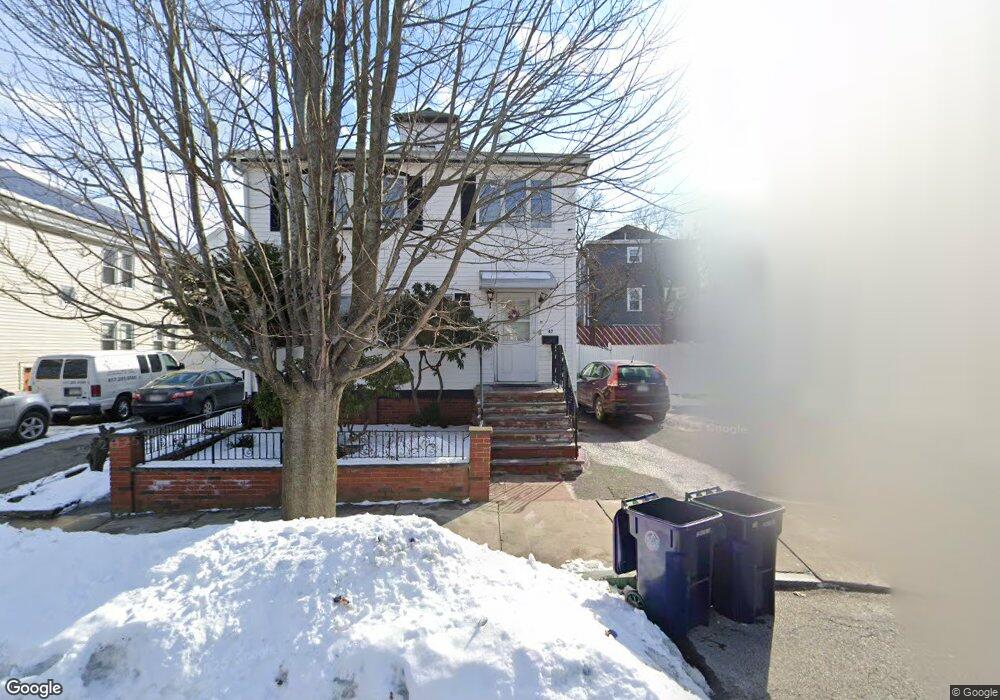
47 Estes St Unit 2 Everett, MA 02149
Glendale NeighborhoodEstimated Value: $878,000 - $1,059,000
3
Beds
2
Baths
1,100
Sq Ft
$858/Sq Ft
Est. Value
About This Home
This home is located at 47 Estes St Unit 2, Everett, MA 02149 and is currently estimated at $943,533, approximately $857 per square foot. 47 Estes St Unit 2 is a home located in Middlesex County with nearby schools including Everett High School, Pioneer Charter School of Science, and Malden Catholic.
Ownership History
Date
Name
Owned For
Owner Type
Purchase Details
Closed on
Mar 29, 1999
Sold by
Iascone Michael R and Iascone Annette M
Bought by
Abdelrazzaq Ibrahim and Abdelrazzaq Rasmieh I
Current Estimated Value
Home Financials for this Owner
Home Financials are based on the most recent Mortgage that was taken out on this home.
Original Mortgage
$200,000
Interest Rate
6.78%
Mortgage Type
Purchase Money Mortgage
Create a Home Valuation Report for This Property
The Home Valuation Report is an in-depth analysis detailing your home's value as well as a comparison with similar homes in the area
Home Values in the Area
Average Home Value in this Area
Purchase History
| Date | Buyer | Sale Price | Title Company |
|---|---|---|---|
| Abdelrazzaq Ibrahim | $225,000 | -- |
Source: Public Records
Mortgage History
| Date | Status | Borrower | Loan Amount |
|---|---|---|---|
| Open | Abdelrazzaq Ibrahim | $160,000 | |
| Closed | Abdelrazzaq Ibrahim | $200,000 | |
| Previous Owner | Abdelrazzaq Ibrahim | $12,000 | |
| Previous Owner | Abdelrazzaq Ibrahim | $45,000 |
Source: Public Records
Tax History
| Year | Tax Paid | Tax Assessment Tax Assessment Total Assessment is a certain percentage of the fair market value that is determined by local assessors to be the total taxable value of land and additions on the property. | Land | Improvement |
|---|---|---|---|---|
| 2025 | $9,393 | $824,700 | $221,700 | $603,000 |
| 2024 | $7,557 | $659,400 | $221,700 | $437,700 |
| 2023 | $7,377 | $626,200 | $212,000 | $414,200 |
| 2022 | $6,071 | $586,000 | $202,400 | $383,600 |
| 2021 | $5,432 | $550,400 | $181,200 | $369,200 |
| 2020 | $5,721 | $537,700 | $181,200 | $356,500 |
| 2019 | $6,035 | $487,500 | $172,500 | $315,000 |
| 2018 | $6,074 | $440,800 | $161,900 | $278,900 |
| 2017 | $5,613 | $388,700 | $134,900 | $253,800 |
| 2016 | $5,029 | $348,000 | $120,500 | $227,500 |
| 2015 | $4,621 | $316,300 | $108,700 | $207,600 |
Source: Public Records
Map
Nearby Homes
- 112 Hadley St
- 5 Mason St
- 881 Broadway Unit 44
- 51 Thurman St
- 859 Broadway Unit 15
- 51 Adams Ave
- 378 Ferry St
- 211 Elm St
- 13 Coolidge St
- 132 Vernal St
- 21 Hillside Ave Unit 21
- 62 Madison Ave
- 19 Mills St
- 85 Winthrop Rd
- 557 Salem St Unit 3
- 557 Salem St Unit 4
- 90 Oxford St
- 272-274 Cross St Unit 4
- 272-274 Cross St Unit 3
- 45 Assunta Rd
Your Personal Tour Guide
Ask me questions while you tour the home.