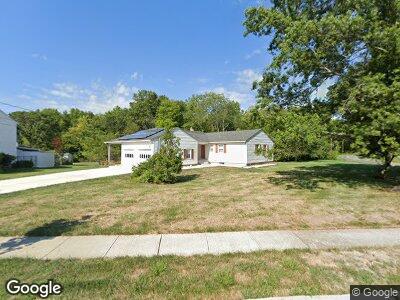
47 Galston Dr Princeton Junction, NJ 08550
Princeton Junction NeighborhoodEstimated Value: $613,306 - $929,000
--
Bed
--
Bath
1,769
Sq Ft
$439/Sq Ft
Est. Value
About This Home
This home is located at 47 Galston Dr, Princeton Junction, NJ 08550 and is currently estimated at $776,827, approximately $439 per square foot. 47 Galston Dr is a home located in Mercer County with nearby schools including Dutch Neck Elementary School, Village Elementary School, and Thomas R. Grover Middle School.
Ownership History
Date
Name
Owned For
Owner Type
Purchase Details
Closed on
Aug 16, 2004
Sold by
Troman Gladys
Bought by
Wu Qimin
Current Estimated Value
Home Financials for this Owner
Home Financials are based on the most recent Mortgage that was taken out on this home.
Original Mortgage
$158,000
Interest Rate
5.77%
Mortgage Type
Purchase Money Mortgage
Purchase Details
Closed on
Oct 30, 1996
Sold by
Kotsinonos Leo
Bought by
Qu Qimin and Aixin Li
Home Financials for this Owner
Home Financials are based on the most recent Mortgage that was taken out on this home.
Original Mortgage
$150,000
Interest Rate
8.1%
Mortgage Type
Purchase Money Mortgage
Create a Home Valuation Report for This Property
The Home Valuation Report is an in-depth analysis detailing your home's value as well as a comparison with similar homes in the area
Home Values in the Area
Average Home Value in this Area
Purchase History
| Date | Buyer | Sale Price | Title Company |
|---|---|---|---|
| Wu Qimin | $197,500 | -- | |
| Qu Qimin | $195,000 | -- |
Source: Public Records
Mortgage History
| Date | Status | Borrower | Loan Amount |
|---|---|---|---|
| Previous Owner | Wu Qimin | $158,000 | |
| Previous Owner | Qu Qimin | $150,000 |
Source: Public Records
Tax History Compared to Growth
Tax History
| Year | Tax Paid | Tax Assessment Tax Assessment Total Assessment is a certain percentage of the fair market value that is determined by local assessors to be the total taxable value of land and additions on the property. | Land | Improvement |
|---|---|---|---|---|
| 2024 | $11,310 | $385,100 | $221,900 | $163,200 |
| 2023 | $11,310 | $385,100 | $221,900 | $163,200 |
| 2022 | $11,091 | $385,100 | $221,900 | $163,200 |
| 2021 | $10,998 | $385,100 | $221,900 | $163,200 |
| 2020 | $10,798 | $385,100 | $221,900 | $163,200 |
| 2019 | $10,675 | $385,100 | $221,900 | $163,200 |
| 2018 | $10,575 | $385,100 | $221,900 | $163,200 |
| 2017 | $10,355 | $385,100 | $221,900 | $163,200 |
| 2016 | $10,132 | $385,100 | $221,900 | $163,200 |
| 2015 | $9,897 | $385,100 | $221,900 | $163,200 |
| 2014 | $9,782 | $385,100 | $221,900 | $163,200 |
Source: Public Records
Map
Nearby Homes