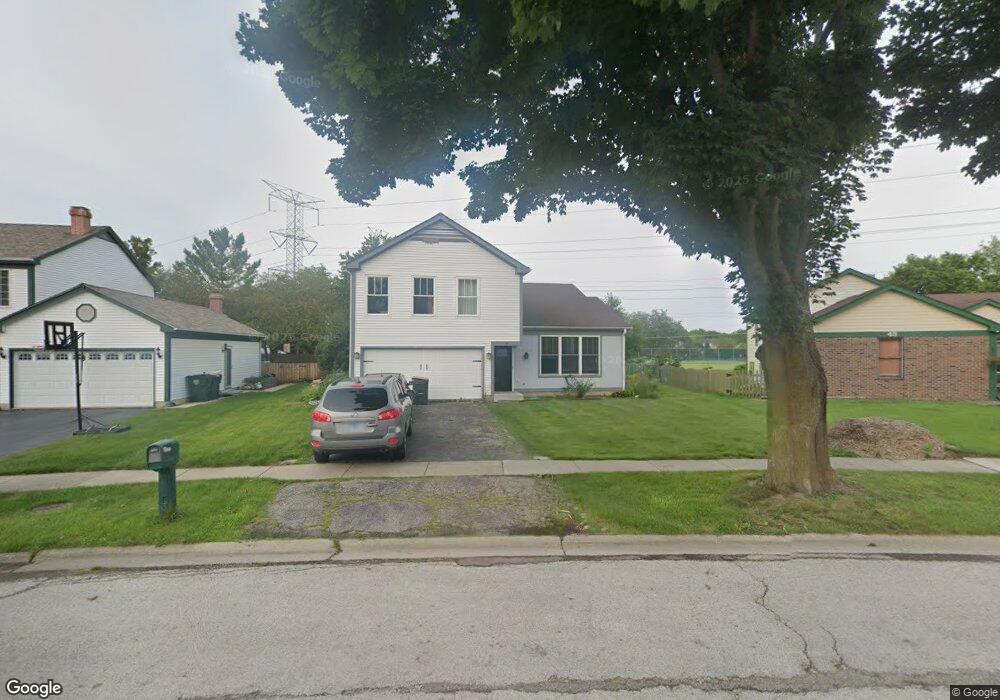
47 George Dr Mundelein, IL 60060
Mundelein Station NeighborhoodEstimated Value: $368,000 - $417,000
3
Beds
3
Baths
1,913
Sq Ft
$204/Sq Ft
Est. Value
About This Home
This home is located at 47 George Dr, Mundelein, IL 60060 and is currently estimated at $389,927, approximately $203 per square foot. 47 George Dr is a home located in Lake County with nearby schools including Hawthorn Elementary School North, Hawthorn School Of Dual Language, and Hawthorn Middle School North.
Ownership History
Date
Name
Owned For
Owner Type
Purchase Details
Closed on
Jul 19, 2021
Sold by
Schramm Jeffrey R and Schramm Jeffrey
Bought by
Schramm Jeffrey
Current Estimated Value
Home Financials for this Owner
Home Financials are based on the most recent Mortgage that was taken out on this home.
Original Mortgage
$112,500
Outstanding Balance
$84,713
Interest Rate
2.1%
Mortgage Type
New Conventional
Estimated Equity
$305,214
Purchase Details
Closed on
Apr 12, 2010
Sold by
Harbaugh John A and Harbaugh Linda S
Bought by
Schramm Jeffrey and Schramm Lisa
Home Financials for this Owner
Home Financials are based on the most recent Mortgage that was taken out on this home.
Original Mortgage
$160,000
Interest Rate
5.16%
Mortgage Type
New Conventional
Purchase Details
Closed on
Mar 21, 2000
Sold by
Mcneil Frederick C and Mcneil Gertrude M
Bought by
Harbaugh John A and Harbaugh Linda S
Home Financials for this Owner
Home Financials are based on the most recent Mortgage that was taken out on this home.
Original Mortgage
$166,250
Interest Rate
8%
Create a Home Valuation Report for This Property
The Home Valuation Report is an in-depth analysis detailing your home's value as well as a comparison with similar homes in the area
Home Values in the Area
Average Home Value in this Area
Purchase History
| Date | Buyer | Sale Price | Title Company |
|---|---|---|---|
| Schramm Jeffrey | -- | Citywide Title Corporation | |
| Schramm Jeffrey | $200,000 | Chicago Title Insurance Co | |
| Harbaugh John A | $175,000 | -- |
Source: Public Records
Mortgage History
| Date | Status | Borrower | Loan Amount |
|---|---|---|---|
| Open | Schramm Jeffrey | $112,500 | |
| Closed | Schramm Jeffrey | $160,000 | |
| Previous Owner | Harbaugh John A | $166,250 |
Source: Public Records
Tax History Compared to Growth
Tax History
| Year | Tax Paid | Tax Assessment Tax Assessment Total Assessment is a certain percentage of the fair market value that is determined by local assessors to be the total taxable value of land and additions on the property. | Land | Improvement |
|---|---|---|---|---|
| 2024 | $7,704 | $93,343 | $19,040 | $74,303 |
| 2023 | $7,641 | $86,094 | $17,561 | $68,533 |
| 2022 | $7,641 | $82,751 | $16,878 | $65,873 |
| 2021 | $7,366 | $80,970 | $16,515 | $64,455 |
| 2020 | $7,235 | $79,608 | $16,237 | $63,371 |
| 2019 | $7,118 | $78,851 | $16,083 | $62,768 |
| 2018 | $7,121 | $79,120 | $16,621 | $62,499 |
| 2017 | $7,019 | $76,622 | $16,096 | $60,526 |
| 2016 | $6,733 | $72,648 | $15,261 | $57,387 |
| 2015 | $6,523 | $67,902 | $14,264 | $53,638 |
| 2014 | $6,413 | $61,822 | $13,030 | $48,792 |
| 2012 | $6,284 | $67,827 | $13,143 | $54,684 |
Source: Public Records
Map
Nearby Homes
- 31 Washington Blvd Unit 108
- 49 N Shaddle Ave
- 1255 Huntington Dr
- 215 Brice Ave
- 701 Thomas Ct
- 841 Wilcox St
- 328 Brice Ave
- 422 Shadow Creek Dr
- 422 James Ave
- 510 S Hickory St
- 847 Mckinley Ave
- 1688 Saint Andrew Dr
- 1726 Shoal Creek Terrace
- 640 Allanson Rd
- 1290 Butterfield Rd
- 2245 Hazeltime Dr
- 433 E High St
- 659 E Maple Ave
- 331 Plaza Cir
- 900 S Butterfield Rd