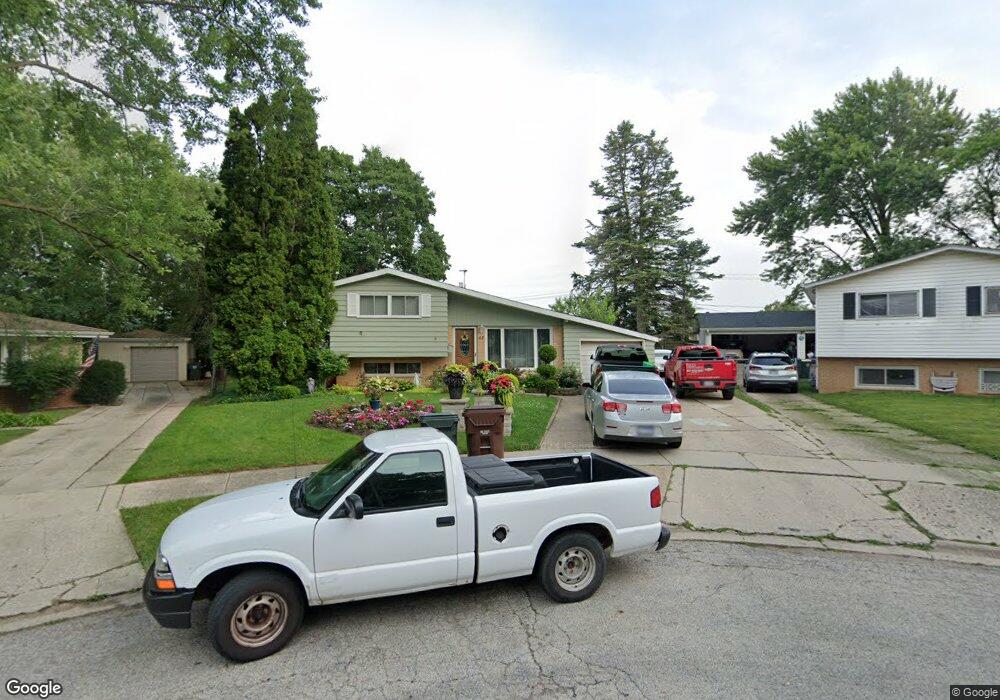
47 Gifford Ct Mundelein, IL 60060
Mundelein Station NeighborhoodEstimated Value: $294,144 - $353,000
--
Bed
2
Baths
1,033
Sq Ft
$318/Sq Ft
Est. Value
About This Home
This home is located at 47 Gifford Ct, Mundelein, IL 60060 and is currently estimated at $328,786, approximately $318 per square foot. 47 Gifford Ct is a home located in Lake County with nearby schools including Hawthorn Elementary School North, Hawthorn School Of Dual Language, and Hawthorn Middle School North.
Ownership History
Date
Name
Owned For
Owner Type
Purchase Details
Closed on
Sep 13, 2010
Sold by
Marinez Juan and Marinez Luis
Bought by
Marinez Jose L and Marinez Maria C
Current Estimated Value
Purchase Details
Closed on
Sep 30, 1997
Sold by
Banister William F and Banister Dorothy R
Bought by
Marinez Luis and Marinez Juan
Home Financials for this Owner
Home Financials are based on the most recent Mortgage that was taken out on this home.
Original Mortgage
$86,912
Outstanding Balance
$14,074
Interest Rate
7.54%
Mortgage Type
FHA
Estimated Equity
$314,712
Create a Home Valuation Report for This Property
The Home Valuation Report is an in-depth analysis detailing your home's value as well as a comparison with similar homes in the area
Home Values in the Area
Average Home Value in this Area
Purchase History
| Date | Buyer | Sale Price | Title Company |
|---|---|---|---|
| Marinez Jose L | -- | None Available | |
| Marinez Luis | $93,333 | Chicago Title Insurance Co |
Source: Public Records
Mortgage History
| Date | Status | Borrower | Loan Amount |
|---|---|---|---|
| Open | Marinez Luis | $86,912 |
Source: Public Records
Tax History Compared to Growth
Tax History
| Year | Tax Paid | Tax Assessment Tax Assessment Total Assessment is a certain percentage of the fair market value that is determined by local assessors to be the total taxable value of land and additions on the property. | Land | Improvement |
|---|---|---|---|---|
| 2024 | $6,721 | $85,659 | $18,741 | $66,918 |
| 2023 | $6,509 | $79,007 | $17,286 | $61,721 |
| 2022 | $6,509 | $71,575 | $16,614 | $54,961 |
| 2021 | $6,254 | $70,034 | $16,256 | $53,778 |
| 2020 | $6,340 | $65,578 | $15,222 | $50,356 |
| 2019 | $6,249 | $64,954 | $15,077 | $49,877 |
| 2018 | $5,638 | $59,541 | $15,235 | $44,306 |
| 2017 | $5,556 | $57,661 | $14,754 | $42,907 |
| 2016 | $5,392 | $54,671 | $13,989 | $40,682 |
| 2015 | $5,211 | $51,099 | $13,075 | $38,024 |
| 2014 | $5,902 | $50,414 | $12,900 | $37,514 |
| 2012 | $4,858 | $53,733 | $14,787 | $38,946 |
Source: Public Records
Map
Nearby Homes
- 49 N Shaddle Ave
- 701 Thomas Ct
- 31 Washington Blvd Unit 108
- 215 Brice Ave
- 841 Wilcox St
- 510 S Hickory St
- 1255 Huntington Dr
- 328 Brice Ave
- 422 James Ave
- 433 E High St
- 640 Allanson Rd
- 1202 Ballantrae Place Unit E
- 847 Mckinley Ave
- 659 E Maple Ave
- 331 Plaza Cir
- 342 Allanson Rd
- 1688 Saint Andrew Dr
- 40 S Seymour Ave
- 422 Shadow Creek Dr
- 1290 Butterfield Rd