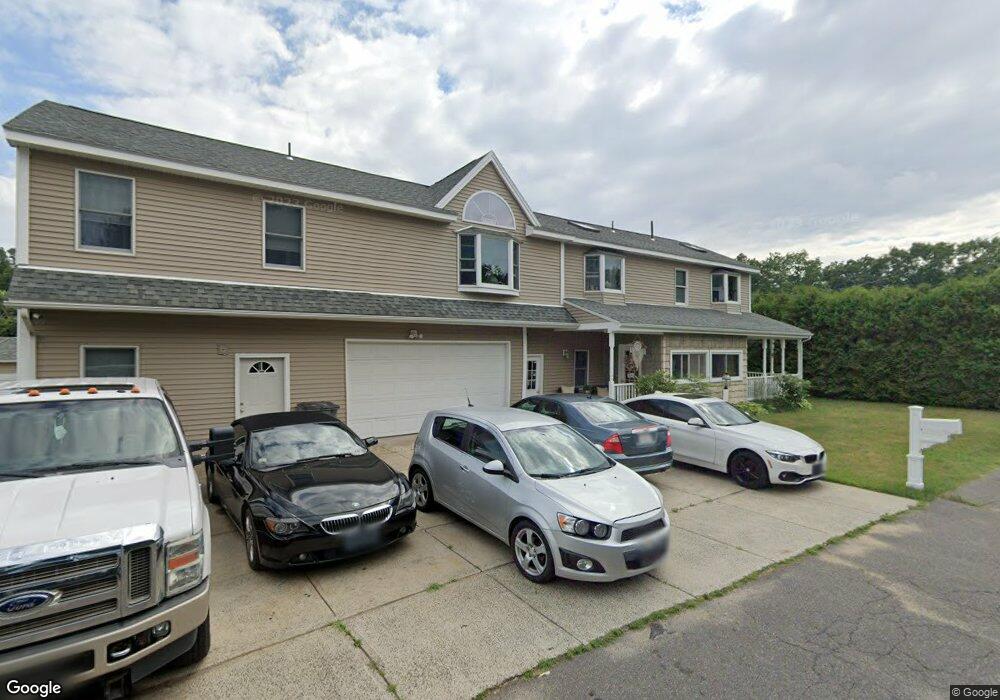
47 Harding Ave Ludlow, MA 01056
Estimated Value: $413,592 - $540,000
4
Beds
3
Baths
2,334
Sq Ft
$193/Sq Ft
Est. Value
About This Home
This home is located at 47 Harding Ave, Ludlow, MA 01056 and is currently estimated at $449,648, approximately $192 per square foot. 47 Harding Ave is a home located in Hampden County with nearby schools including East Street Elementary School, Chapin Street Elementary School, and Paul R. Baird Middle School.
Ownership History
Date
Name
Owned For
Owner Type
Purchase Details
Closed on
Nov 26, 2008
Sold by
Fnma
Bought by
Fields Amy J
Current Estimated Value
Home Financials for this Owner
Home Financials are based on the most recent Mortgage that was taken out on this home.
Original Mortgage
$206,600
Interest Rate
6.47%
Mortgage Type
Purchase Money Mortgage
Purchase Details
Closed on
Mar 13, 2008
Sold by
Godbout Peter J and National City Mtg
Bought by
Federal National Mortgage Association
Purchase Details
Closed on
Apr 29, 2005
Sold by
Trembley Stephen R
Bought by
Godbout Peter J
Home Financials for this Owner
Home Financials are based on the most recent Mortgage that was taken out on this home.
Original Mortgage
$204,000
Interest Rate
5.95%
Mortgage Type
Purchase Money Mortgage
Create a Home Valuation Report for This Property
The Home Valuation Report is an in-depth analysis detailing your home's value as well as a comparison with similar homes in the area
Home Values in the Area
Average Home Value in this Area
Purchase History
| Date | Buyer | Sale Price | Title Company |
|---|---|---|---|
| Fields Amy J | $217,500 | -- | |
| Fields Amy J | $217,500 | -- | |
| Federal National Mortgage Association | $214,984 | -- | |
| Federal National Mortgage Association | $214,984 | -- | |
| Godbout Peter J | $255,000 | -- | |
| Godbout Peter J | $255,000 | -- |
Source: Public Records
Mortgage History
| Date | Status | Borrower | Loan Amount |
|---|---|---|---|
| Open | Godbout Peter J | $200,000 | |
| Closed | Fields Amy J | $206,600 | |
| Previous Owner | Godbout Peter J | $204,000 |
Source: Public Records
Tax History Compared to Growth
Tax History
| Year | Tax Paid | Tax Assessment Tax Assessment Total Assessment is a certain percentage of the fair market value that is determined by local assessors to be the total taxable value of land and additions on the property. | Land | Improvement |
|---|---|---|---|---|
| 2025 | $6,303 | $363,300 | $82,000 | $281,300 |
| 2024 | $5,814 | $321,400 | $82,000 | $239,400 |
| 2023 | $5,599 | $287,000 | $72,000 | $215,000 |
| 2022 | $5,283 | $264,300 | $72,000 | $192,300 |
| 2021 | $5,266 | $249,800 | $72,000 | $177,800 |
| 2020 | $5,042 | $244,500 | $70,900 | $173,600 |
| 2019 | $4,767 | $240,500 | $70,200 | $170,300 |
| 2018 | $4,452 | $234,200 | $70,200 | $164,000 |
| 2017 | $4,284 | $231,200 | $68,800 | $162,400 |
| 2016 | $4,166 | $229,800 | $67,400 | $162,400 |
| 2015 | $3,906 | $225,900 | $66,700 | $159,200 |
Source: Public Records
Map
Nearby Homes
- 42 Loopley St
- 60 Loopley St
- 98 Fuller St Unit 32
- 84 Fuller St Unit 1
- 70 Fuller St
- 32 White St
- 517 Ideal Ln Unit 401
- 0 Fuller St Unit 73409741
- 84 Chapin Greene Dr
- 87 Haviland St
- 24 Elm St
- 51 Parkview St
- 87 Prokop Ave
- 70 Sroka Ln
- 148 Yale St
- 41 Orchard St
- 142 Amherst St
- 287 East St
- 0 Center St Unit 73415933
- 61 Massachusetts Ave