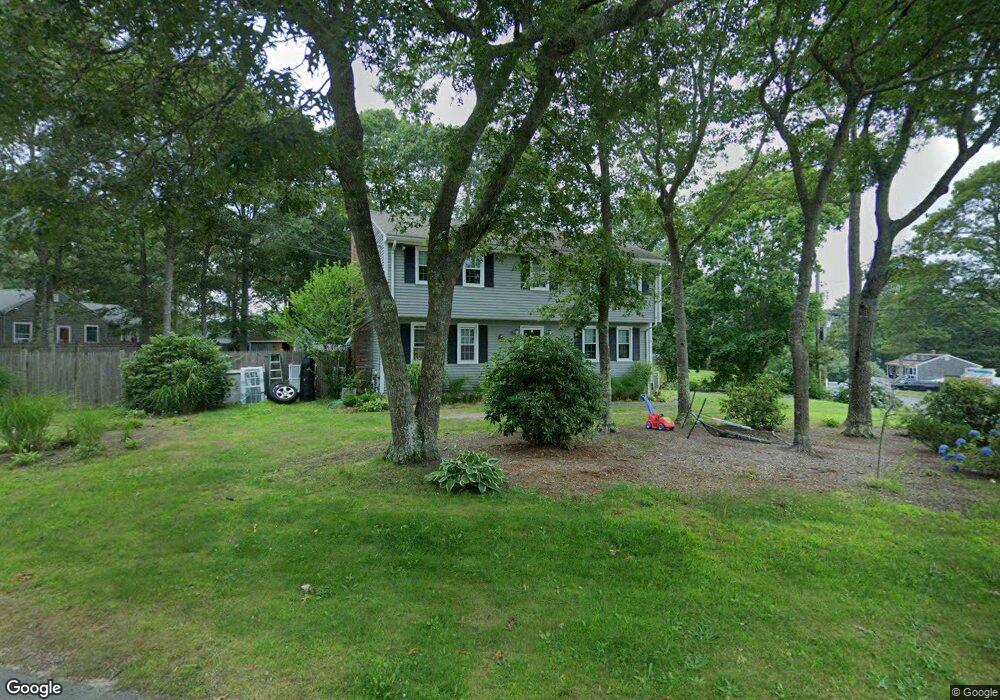
47 Howard Ave Bourne, MA 2532
Monument Beach NeighborhoodEstimated Value: $645,000 - $769,000
3
Beds
3
Baths
1,900
Sq Ft
$356/Sq Ft
Est. Value
About This Home
This home is located at 47 Howard Ave, Bourne, MA 2532 and is currently estimated at $677,106, approximately $356 per square foot. 47 Howard Ave is a home located in Barnstable County with nearby schools including Bourne High School, Cadence Academy Preschool - Bourne, and St Margaret Regional School.
Ownership History
Date
Name
Owned For
Owner Type
Purchase Details
Closed on
Jul 14, 2015
Sold by
Bird Charles R and Bird Donna M
Bought by
Dennen Mark and Dennen Ashley B
Current Estimated Value
Home Financials for this Owner
Home Financials are based on the most recent Mortgage that was taken out on this home.
Original Mortgage
$272,000
Outstanding Balance
$210,974
Interest Rate
3.87%
Mortgage Type
New Conventional
Estimated Equity
$466,132
Purchase Details
Closed on
Dec 1, 1997
Sold by
Testa Jean M
Bought by
Bird Charles R
Create a Home Valuation Report for This Property
The Home Valuation Report is an in-depth analysis detailing your home's value as well as a comparison with similar homes in the area
Home Values in the Area
Average Home Value in this Area
Purchase History
| Date | Buyer | Sale Price | Title Company |
|---|---|---|---|
| Dennen Mark | $340,000 | -- | |
| Dennen Mark | $340,000 | -- | |
| Bird Charles R | $134,500 | -- | |
| Bird Charles R | $134,500 | -- |
Source: Public Records
Mortgage History
| Date | Status | Borrower | Loan Amount |
|---|---|---|---|
| Open | Dennen Mark | $272,000 | |
| Closed | Dennen Mark | $272,000 | |
| Previous Owner | Bird Charles R | $296,250 | |
| Previous Owner | Bird Charles R | $225,000 |
Source: Public Records
Tax History
| Year | Tax Paid | Tax Assessment Tax Assessment Total Assessment is a certain percentage of the fair market value that is determined by local assessors to be the total taxable value of land and additions on the property. | Land | Improvement |
|---|---|---|---|---|
| 2025 | $4,718 | $604,100 | $192,300 | $411,800 |
| 2024 | $4,615 | $575,400 | $183,200 | $392,200 |
| 2023 | $4,487 | $509,300 | $162,100 | $347,200 |
| 2022 | $4,230 | $419,200 | $143,500 | $275,700 |
| 2021 | $4,111 | $381,700 | $130,600 | $251,100 |
| 2020 | $3,970 | $369,600 | $129,300 | $240,300 |
| 2019 | $3,769 | $358,600 | $129,300 | $229,300 |
| 2018 | $3,539 | $335,800 | $117,300 | $218,500 |
| 2017 | $3,425 | $332,500 | $116,200 | $216,300 |
| 2016 | $3,276 | $322,400 | $116,200 | $206,200 |
| 2015 | $2,689 | $267,000 | $116,200 | $150,800 |
Source: Public Records
Map
Nearby Homes
- 20 Colony Ave
- 4 Harbor Hill Dr
- 16 Amberwood Ct
- 566 Shore Rd
- 203 County Rd
- 12 Turnberry Rd Unit 12
- 4 Hollyhock Knoll Ct Unit 4
- 4 Hollyhock Knoll Ct Unit 4
- 3 1st St
- 13 Laurel Hill Ct
- 5 Sea Knoll Ct
- 709 County Rd
- 3 4th Ave
- 7 4th Ave
- 254 Barlows Landing Rd
- 14 Navajo Rd
- 16 Michael Rd
- 5 Zoli Ln
- 44 Cotuit Rd
- 35 Benedict Rd
Your Personal Tour Guide
Ask me questions while you tour the home.