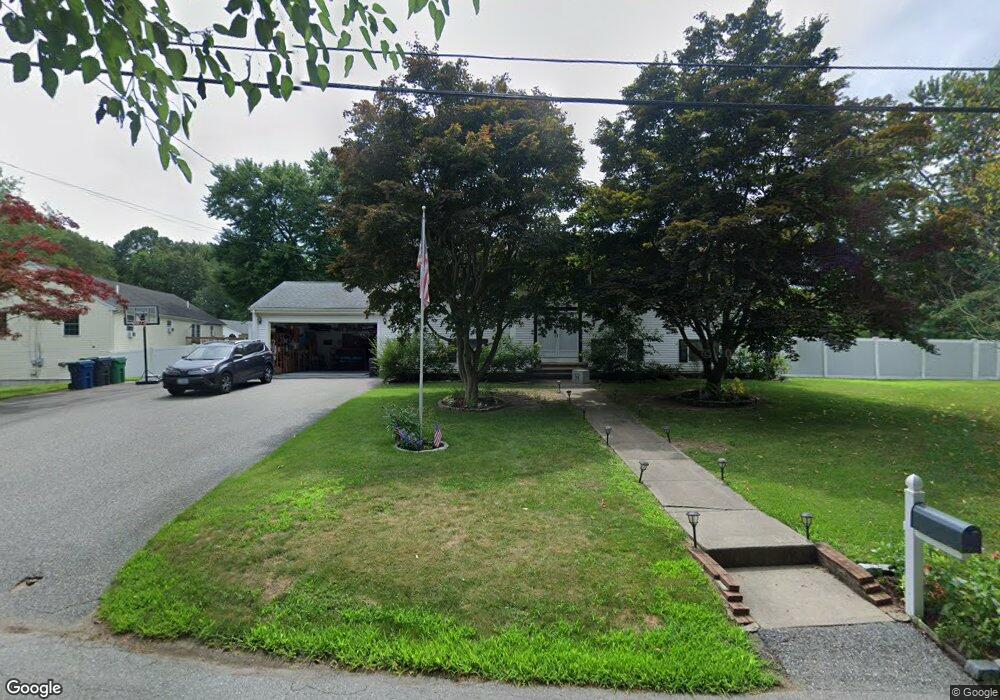
47 June Ave Warwick, RI 02889
Conimicut-Shawomet NeighborhoodEstimated Value: $509,439 - $576,000
3
Beds
2
Baths
2,800
Sq Ft
$189/Sq Ft
Est. Value
About This Home
This home is located at 47 June Ave, Warwick, RI 02889 and is currently estimated at $529,610, approximately $189 per square foot. 47 June Ave is a home located in Kent County with nearby schools including Saint Kevin School and Bishop Hendricken High School.
Ownership History
Date
Name
Owned For
Owner Type
Purchase Details
Closed on
Jun 26, 2019
Sold by
Fitz-Simon John A and Fitz-Simon Wendy A
Bought by
Carlson Christopher A and Carlson Amanda J
Current Estimated Value
Home Financials for this Owner
Home Financials are based on the most recent Mortgage that was taken out on this home.
Original Mortgage
$232,500
Outstanding Balance
$203,580
Interest Rate
4%
Mortgage Type
New Conventional
Estimated Equity
$326,030
Purchase Details
Closed on
Jun 29, 2006
Sold by
Donnell Willard F and Donnell Eileen M
Bought by
Fitz-Simon 3Rd John A and Fitz-Simon Wendy A
Home Financials for this Owner
Home Financials are based on the most recent Mortgage that was taken out on this home.
Original Mortgage
$298,350
Interest Rate
6.58%
Mortgage Type
Purchase Money Mortgage
Purchase Details
Closed on
May 20, 2002
Sold by
Henninger Robert J and Henninger Cynthia A
Bought by
Donnell Willard F
Create a Home Valuation Report for This Property
The Home Valuation Report is an in-depth analysis detailing your home's value as well as a comparison with similar homes in the area
Home Values in the Area
Average Home Value in this Area
Purchase History
| Date | Buyer | Sale Price | Title Company |
|---|---|---|---|
| Carlson Christopher A | $327,500 | -- | |
| Fitz-Simon 3Rd John A | $366,000 | -- | |
| Donnell Willard F | $200,000 | -- |
Source: Public Records
Mortgage History
| Date | Status | Borrower | Loan Amount |
|---|---|---|---|
| Open | Carlson Christopher A | $232,500 | |
| Previous Owner | Donnell Willard F | $298,350 | |
| Previous Owner | Donnell Willard F | $20,000 | |
| Previous Owner | Donnell Willard F | $20,400 |
Source: Public Records
Tax History Compared to Growth
Tax History
| Year | Tax Paid | Tax Assessment Tax Assessment Total Assessment is a certain percentage of the fair market value that is determined by local assessors to be the total taxable value of land and additions on the property. | Land | Improvement |
|---|---|---|---|---|
| 2025 | $6,062 | $477,300 | $119,600 | $357,700 |
| 2024 | $6,035 | $417,100 | $98,700 | $318,400 |
| 2023 | $5,919 | $417,100 | $98,700 | $318,400 |
| 2022 | $5,773 | $308,200 | $66,100 | $242,100 |
| 2021 | $5,773 | $308,200 | $66,100 | $242,100 |
| 2020 | $5,773 | $308,200 | $66,100 | $242,100 |
| 2019 | $5,773 | $308,200 | $66,100 | $242,100 |
| 2018 | $5,426 | $268,100 | $74,500 | $193,600 |
| 2017 | $5,426 | $268,100 | $74,500 | $193,600 |
| 2016 | $5,426 | $268,100 | $74,500 | $193,600 |
| 2015 | $5,241 | $252,600 | $79,400 | $173,200 |
| 2014 | $5,067 | $252,600 | $79,400 | $173,200 |
| 2013 | $4,999 | $252,600 | $79,400 | $173,200 |
Source: Public Records
Map
Nearby Homes