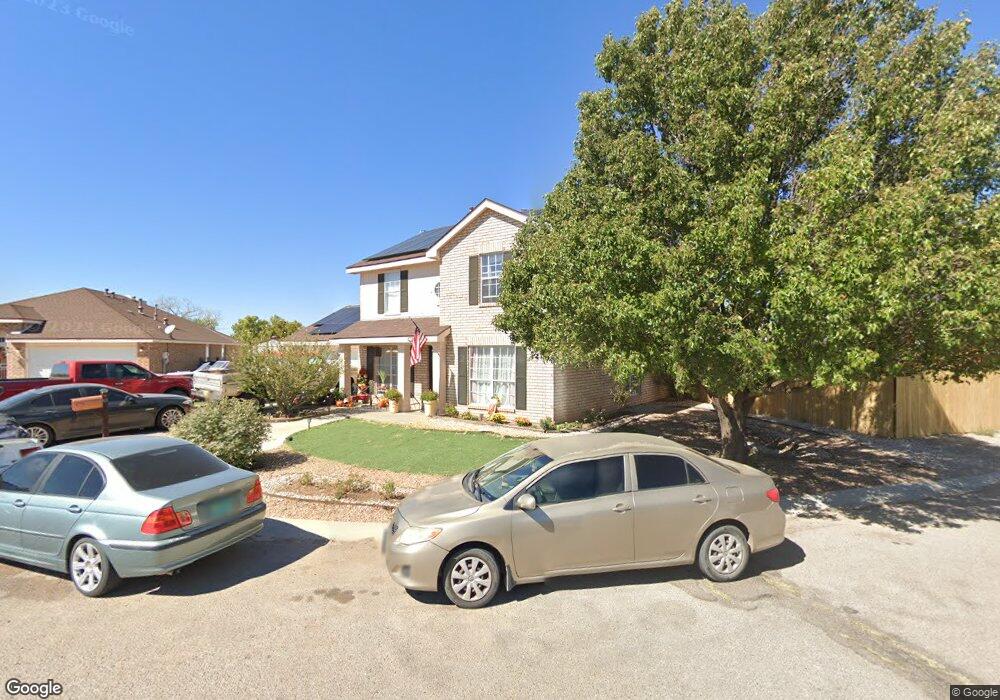
47 Juniper Ave Unit 2 Los Lunas, NM 87031
Las Maravillas NeighborhoodEstimated Value: $262,000 - $290,000
3
Beds
3
Baths
1,832
Sq Ft
$150/Sq Ft
Est. Value
About This Home
This home is located at 47 Juniper Ave Unit 2, Los Lunas, NM 87031 and is currently estimated at $275,710, approximately $150 per square foot. 47 Juniper Ave Unit 2 is a home located in Valencia County with nearby schools including Belen High School.
Ownership History
Date
Name
Owned For
Owner Type
Purchase Details
Closed on
Oct 21, 2021
Sold by
Smith Gary L and Smith Anita D
Bought by
Laskaris Effie K
Current Estimated Value
Purchase Details
Closed on
Mar 16, 2009
Sold by
Deutsche Bank National Trust Co
Bought by
Chavez David R and Chavez Tracy B
Home Financials for this Owner
Home Financials are based on the most recent Mortgage that was taken out on this home.
Original Mortgage
$107,908
Interest Rate
5.21%
Mortgage Type
FHA
Purchase Details
Closed on
Feb 8, 2006
Sold by
Secretary Of Veterans Affairs
Bought by
Swanson Kenneth
Home Financials for this Owner
Home Financials are based on the most recent Mortgage that was taken out on this home.
Original Mortgage
$132,825
Interest Rate
6.24%
Mortgage Type
New Conventional
Purchase Details
Closed on
Oct 5, 2005
Sold by
Citimortgage Inc
Bought by
Secretary Of Veterans Affairs
Purchase Details
Closed on
Sep 6, 2005
Sold by
County Of Valencia
Bought by
Citimortgage Inc
Create a Home Valuation Report for This Property
The Home Valuation Report is an in-depth analysis detailing your home's value as well as a comparison with similar homes in the area
Home Values in the Area
Average Home Value in this Area
Purchase History
| Date | Buyer | Sale Price | Title Company |
|---|---|---|---|
| Laskaris Effie K | -- | First American Title Ins Co | |
| Chavez David R | -- | -- | |
| Swanson Kenneth | -- | None Available | |
| Secretary Of Veterans Affairs | -- | None Available | |
| Citimortgage Inc | -- | None Available |
Source: Public Records
Mortgage History
| Date | Status | Borrower | Loan Amount |
|---|---|---|---|
| Previous Owner | Chavez David R | $107,908 | |
| Previous Owner | Swanson Kenneth | $132,825 |
Source: Public Records
Tax History Compared to Growth
Tax History
| Year | Tax Paid | Tax Assessment Tax Assessment Total Assessment is a certain percentage of the fair market value that is determined by local assessors to be the total taxable value of land and additions on the property. | Land | Improvement |
|---|---|---|---|---|
| 2024 | $1,222 | $53,889 | $5,464 | $48,425 |
| 2023 | $1,199 | $52,320 | $5,464 | $46,856 |
| 2022 | $1,155 | $50,796 | $5,464 | $45,332 |
| 2021 | $1,037 | $49,317 | $5,628 | $43,689 |
| 2020 | $1,018 | $47,880 | $5,464 | $42,416 |
| 2019 | $1,015 | $47,880 | $5,464 | $42,416 |
| 2018 | $1,004 | $47,876 | $5,464 | $42,412 |
| 2017 | $973 | $46,482 | $5,464 | $41,018 |
| 2016 | $931 | $45,128 | $5,464 | $39,664 |
| 2015 | -- | $43,814 | $5,464 | $38,350 |
| 2013 | -- | $41,299 | $5,464 | $35,835 |
| 2011 | -- | $120,288 | $15,915 | $104,373 |
Source: Public Records
Map
Nearby Homes
- 33 Apache Plume Rd
- 16 Apache Plume Rd
- 16 Lirio Place
- 43 Violeta Place
- 0 Rio Del Oro (U8 B52 L12 13 14) Unit 1072499
- 9 Genesis Place
- 0 Camino La Canada Unit 1022639
- Lot 26, 27 28 Block: 27 Unit: 54
- 4 Aldea Place
- 0 Chacon Blvd
- Xxx Non Name (S) of La Endrada Rd
- 26 Aldea Place
- 0 Rio Del Oro Loop N
- 1 Lot S Rio Del Oro Loop
- 0 S Rio Del Oro Loop Unit 15 1091374
- RDO Unit 51
- 0 La Entrada Rd
- 22 S Rio Del Oro Loop
- 40 Vista Colinas
- 0 Patricio Rd & La Entrada Rd Unit 1027319