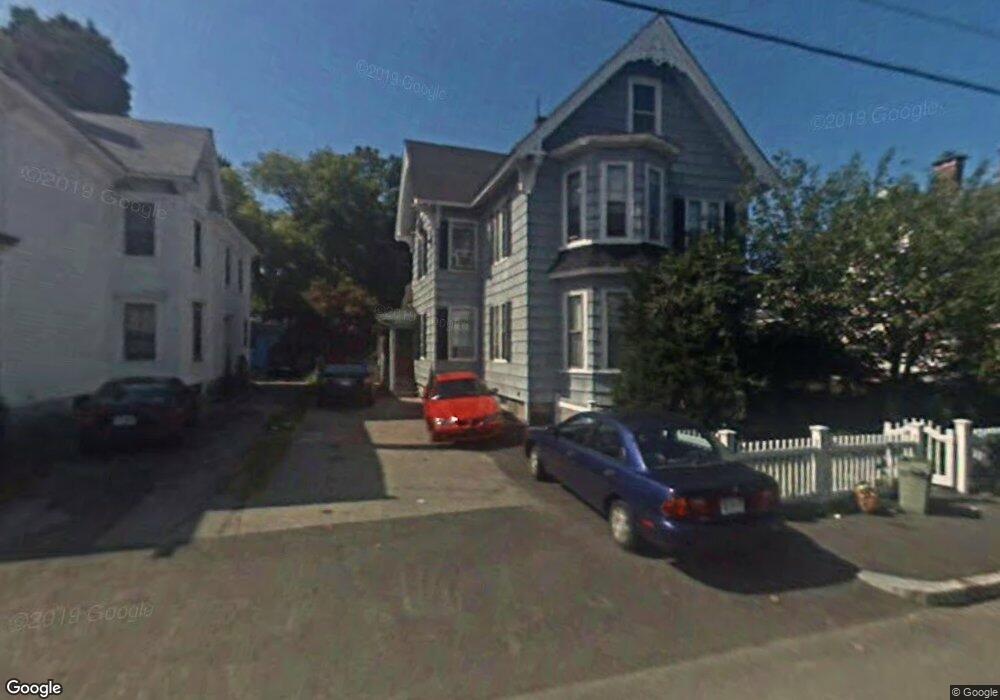
47 Loring St Lowell, MA 01851
Lower Highlands NeighborhoodEstimated Value: $760,000 - $876,000
6
Beds
3
Baths
4,267
Sq Ft
$192/Sq Ft
Est. Value
About This Home
This home is located at 47 Loring St, Lowell, MA 01851 and is currently estimated at $821,000, approximately $192 per square foot. 47 Loring St is a home located in Middlesex County with nearby schools including Charles W. Morey Elementary School, Abraham Lincoln Elementary School, and Charlotte M. Murkland Elementary School.
Ownership History
Date
Name
Owned For
Owner Type
Purchase Details
Closed on
May 11, 2010
Sold by
Mcteague Joseph B and Williams Lisa A
Bought by
Loring Street Llc
Current Estimated Value
Home Financials for this Owner
Home Financials are based on the most recent Mortgage that was taken out on this home.
Original Mortgage
$160,000
Outstanding Balance
$107,137
Interest Rate
5.03%
Mortgage Type
Purchase Money Mortgage
Estimated Equity
$713,863
Purchase Details
Closed on
Jun 24, 2005
Sold by
Bureau Claire R
Bought by
Mcteague Joseph B and Mcteague Lisa A
Home Financials for this Owner
Home Financials are based on the most recent Mortgage that was taken out on this home.
Original Mortgage
$311,900
Interest Rate
5.82%
Mortgage Type
Purchase Money Mortgage
Create a Home Valuation Report for This Property
The Home Valuation Report is an in-depth analysis detailing your home's value as well as a comparison with similar homes in the area
Home Values in the Area
Average Home Value in this Area
Purchase History
| Date | Buyer | Sale Price | Title Company |
|---|---|---|---|
| Loring Street Llc | $230,000 | -- | |
| Loring Street Llc | $230,000 | -- | |
| Mcteague Joseph B | $389,900 | -- | |
| Mcteague Joseph B | $389,900 | -- |
Source: Public Records
Mortgage History
| Date | Status | Borrower | Loan Amount |
|---|---|---|---|
| Open | Loring Street Llc | $160,000 | |
| Closed | Mcteague Joseph B | $160,000 | |
| Previous Owner | Mcteague Joseph B | $311,900 |
Source: Public Records
Tax History
| Year | Tax Paid | Tax Assessment Tax Assessment Total Assessment is a certain percentage of the fair market value that is determined by local assessors to be the total taxable value of land and additions on the property. | Land | Improvement |
|---|---|---|---|---|
| 2025 | $8,423 | $733,700 | $165,300 | $568,400 |
| 2024 | $7,969 | $669,100 | $148,800 | $520,300 |
| 2023 | $7,785 | $626,800 | $129,300 | $497,500 |
| 2022 | $7,226 | $569,400 | $117,600 | $451,800 |
| 2021 | $6,264 | $465,400 | $102,300 | $363,100 |
| 2020 | $5,605 | $419,500 | $89,400 | $330,100 |
| 2019 | $5,442 | $387,600 | $82,800 | $304,800 |
| 2018 | $4,923 | $342,100 | $75,400 | $266,700 |
| 2017 | $4,661 | $312,400 | $68,500 | $243,900 |
| 2016 | $4,330 | $285,600 | $65,200 | $220,400 |
| 2015 | $4,133 | $267,000 | $66,800 | $200,200 |
| 2013 | $3,689 | $245,800 | $79,900 | $165,900 |
Source: Public Records
Map
Nearby Homes
- 3 Butman Place
- 312 Wilder St
- 11 Warwick St Unit 3
- 19 Lawton St
- 30 Grace St
- 68 Smith St
- 42 Branch St
- 137 Pine St Unit 11
- 18 Burgess St
- 143 Westford St
- 710 School St
- 15 Barclay St
- 17 Edson St
- 45 Marshall St
- 49 Marginal St
- 45 Harvard St Unit 5 3rd fl
- 85 B St
- 173 Princeton Blvd
- 234 Foster St
- 186 Powell St
- 51 Loring St
- 39 Loring St
- 90 Grove St
- 57 Loring St
- 3 Wellington Square
- 1 Wellington Square
- 3 Wellington Square
- 61 Loring St
- 52 Loring St
- 46 Loring St
- 96 Grove St Unit 2
- 98 Grove St Unit 2
- 98 Grove St Unit 3
- 96 Grove St Unit 1
- 96 Grove St Unit 3
- 56 Loring St
- 65 Loring St
- 60 Loring St
- 89 Grove St
- 62 Grove St
Your Personal Tour Guide
Ask me questions while you tour the home.